Shipping an application to the production requires reliable mechanisms responsible for auditing, health checks, and metrics collection. Fortunately, with Spring Boot we can apply those features effortlessly and monitor an app with Actuator.
What we’re going to build
In this article you can read how to:
- add Actuator to a Spring Boot project and use its HTTP endpoints;
- enable/disable chosen endpoints;
- configure the
infoendpoint to show some data already defined in the project’spom.xmlfile; - configure the
healthendpoint to display more details; - secure the
healthdetails and other endpoints.
Meanwhile, you can clone the example spring-boot-log4j-2-scaffolding project from my GitHub repository and test it locally.
Add Actuator to a Spring Boot project
If you use Maven, add the Spring Boot Starter Actuator maven dependency to the pom.xml file:
|
1 2 3 4 5 6 7 |
# pom.xml … <dependency> <groupId>org.springframework.boot</groupId> <artifactId>spring-boot-starter-actuator</artifactId> </dependency> … |
You can find how to add the dependency if you use Gradle in the documentation. The plugin is auto-configured. That’s why we can monitor a Spring Boot app with Actuator so effortlessly.
Actuator endpoints
Actuator makes monitoring straightforward and provides a deep insight due to the comprehensive and extendable set of configurable endpoints. To begin with, run the application and go to http://localhost:8080/actuator/ to see the default endpoints:
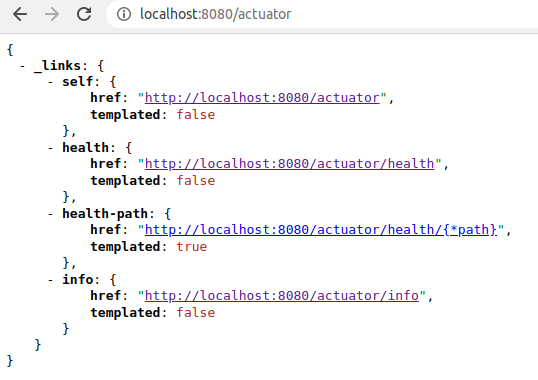
What details of a Spring Boot app you can monitor with default Actuator settings
Almost all endpoints (except for http://localhost:8080/actuator/shutdown) are enabled. However, they won’t be listed under the /actuator endpoint, unless you explicitly expose them. In order to see all enabled endpoints, expose them in the application.properties file with the following line:
|
1 2 |
# application.properties management.endpoints.web.exposure.include=* |
After that, restart the application and visit http://localhost:8080/actuator/. As a result, you’ll be able to see a new, longer response:
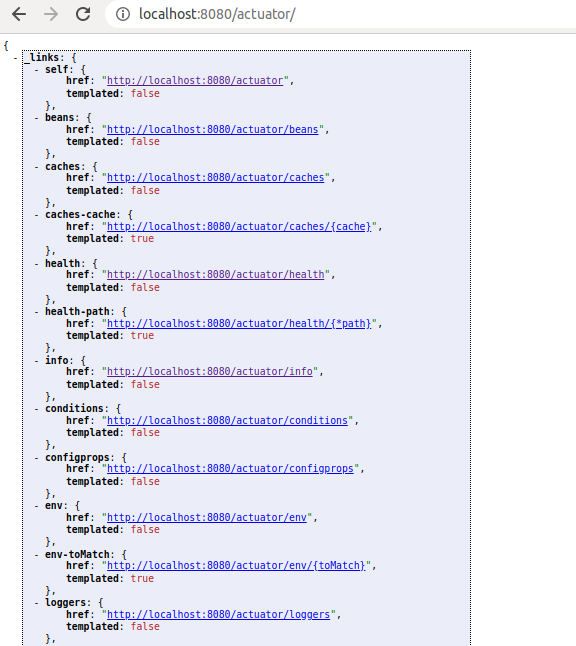
How to configure endpoints availability
Similarly, if you want to enable only a few endpoints, you have to modify the app’s properties as follows:
|
1 2 3 4 |
# application.properties management.endpoints.enabled-by-default=false management.endpoint.info.enabled=true management.endpoints.web.exposure.include=info |
In other words, we:
- disabled all endpoints;
- enabled and exposed only one –
info;
As a result, we’ll see the following response after rebuilding the app:
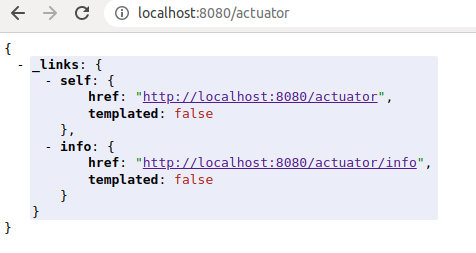
Disabling an endpoint removes it from the application context completely. On the other hand, you can use only the exclude and include properties to configure the endpoints availability. Therefore, they can remain in the application context, even though they are hidden from a user. I’m going to configure the management.endpoints.web.exposure.include property. As a result, Actuator will serve the info, health and metrics endpoints in the browser and the rest of the endpoints will keep their default – enabled state:
|
1 2 |
# application.properties management.endpoints.web.exposure.include=info,health,metrics |
Consequently, my chosen endpoints are listed on the screenshot below:
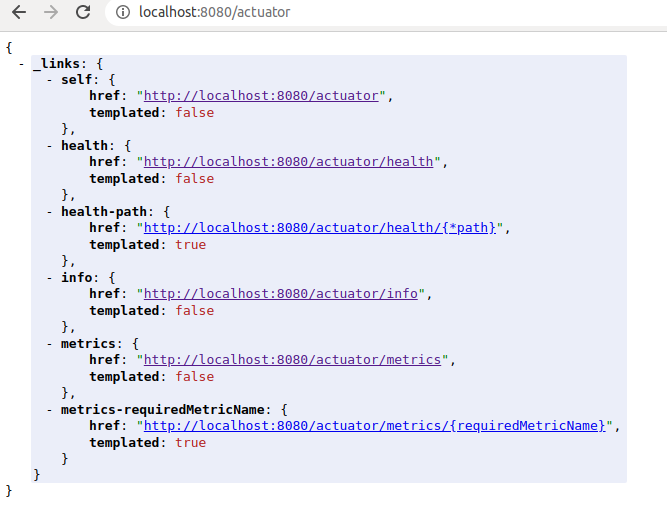
On the other hand, if you want to exclude an enabled endpoint, pass it to the management.endpoints.web.exposure.exclude property.
Configure the info endpoint
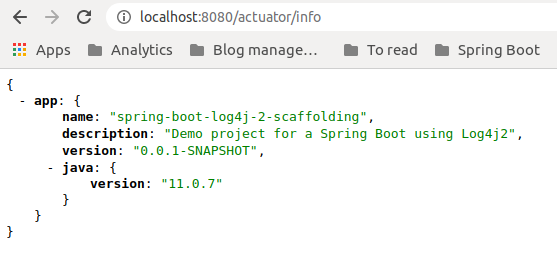
The http://localhost:8080/actuator/info path returns an empty json by default. We’re going to configure what info should be displayed. For that purpose, I’m going to add the same information that are defined in the pom.xml file, as explained in the docs:
You can automatically expand properties from the Maven project by using resource filtering. If you use the
https://docs.spring.io/spring-boot/docs/current/reference/html/howto.html#howto-automatic-expansion-mavenspring-boot-starter-parent, you can then refer to your Maven ‘project properties’ with@..@placeholders (…).
According to the documentation, I can add to the properties the following lines:
|
1 2 3 4 5 6 |
# application.properties … info.app.name=@name@ info.app.description=@description@ info.app.version=@version@ info.app.java.version=@java.version@ |
After restarting the app, I can see the data returned by the info endpoint:
Monitoring the health of your app
The http://localhost:8080/actuator/health endpoints returns a simple health check by default:

Later in this post, we’re going to add details to its response in a secure manner.
The default endpoint list includes actuator/health/{*path} as well. This gives you the possibility to:
- arrange health indicators into groups – e.g. to create a group that contains only database indicators;
- gather data about application availability if you deploy it on Kubernetes (Kubernetes Probes).
Browse the app metrics
On the screenshot below you can see some of the available metrics for the application:

In order to see a metric details, add its name to the /actuator/metrics endpoint:

Protect Actuator endpoints with Spring Boot security
At this point, all enabled and exposed endpoints are available for everyone. In reality, you don’t want to expose such sensitive information to outsiders.
Enable Spring Boot security
Add the Spring Boot Starter Security dependency to your pom.xml file:
|
1 2 3 4 5 6 7 |
# pom.xml … <dependency> <groupId>org.springframework.boot</groupId> <artifactId>spring-boot-starter-security</artifactId> </dependency> … |
For the sake of simplicity, I set up default credentials in the application.properties file:
|
1 2 3 4 |
# application.properties … spring.security.user.name=test spring.security.user.password=test |
Remember to override those simple values when shipping to production!
Verify whether endpoints are secured
Restart the application and visit http://localhost:8080/actuator. You’ll see the login form:

All endpoints except for info and health are available only after you’d successfully singed in. However, you can customize security configuration to:
- enable unauthorized access to some endpoints;
- only allow users with a certain role to access specified endpoints.
Get more detailed health information
Since the Actuator endpoints are secured, we can configure the /actuator/health endpoint to provide more details for an authorised user.
Monitor health components
Configure the management.endpoint.health.show-components property, so that you can see the health components:
|
1 2 3 |
# application.properties … management.endpoint.health.show-components=WHEN_AUTHORIZED |
Consequently, the health output will look like on the screenshot below:

Monitor health details
For more detailed response, use the management.endpoint.health.show-details property instead:
|
1 2 3 |
# application.properties … management.endpoint.health.show-details=WHEN_AUTHORIZED |
On the following screenshot you can see that the response includes more data:

- For a non-authorised user this endpoint will still show only UP/DOWN
status. - What’s more, you can write your own health indicators for more customizable heatlh checks.
- Furthermore, details shown above are collected by DiskSpaceHealthIndicator which is auto-configured by Spring Boot.
| Most importantly, don’t forget to take care of logging. Checking health isn’t enough when you can’t browse logs (e.g. in Kibana) to actually debug what happened. |
To sum up, including Actuator in a project is a first step towards responsible metrics management. Especially since it provides auto-configuration and dependency handling for Micrometer – a metrics instrumentation library enabling transparent integrations with the most popular monitoring systems.
In addition, you can find the code that enables us to monitor Spring Boot with Actuator in the commit f860e3be2125c78527ab74306ec0f9c17e658fd4.
Learn more on how to monitor Spring Boot with Actuator
- Spring Boot Actuator: Production-ready Features
- Spring Boot Actuator Web API Documentation
- Securing Actuator Endpoints
- Implementing Custom Endpoints
- Spring Boot Actuator: Health check, Auditing, Metrics gathering and Monitoring
Photo by Retha Ferguson from Pexels
