Gather metrics and statistics from Elastic Stack with Metricbeat and monitor the services using a Kibana dashboard.
What we’re going to build
We’re going to add the monitoring functionality to the Elastic Stack services used in the spring-boot-log4j-2-scaffolding application. As a result, we’ll be able to view metrics collected from Elasticsearch, Kibana, Logstash and Filebeat in a Kibana dashboard. All services will run in Docker containers. Meanwhile, You can clone the project and test it locally with Docker Compose.
Introducing Metricbeat
Metricbeat collects the metrics and statistics from services and ships them to the output, in this example – Elasticsearch with minimum required configuration. Thus, it is a recommended tool for monitoring Elastic Stack in a production environment:
https://www.elastic.co/guide/en/elasticsearch/reference/current/monitoring-production.html
Metricbeat is the recommended method for collecting and shipping monitoring data to a monitoring cluster. If you have previously configured internal collection, you should migrate to using Metricbeat collection. Use either Metricbeat collection or internal collection; do not use both.
Firstly, we’re going to enclose our configuration for Metricbeat in a single file – metricbeat.yml. To see all non-deprecated configuration options visit the reference file. The configuration file used in this article has the following structure:
|
1 2 3 4 5 6 7 8 9 10 11 12 13 14 15 |
# metricbeat/metricbeat.yml metricbeat: modules: - module: elasticsearch … - module: kibana … - module: logstash … - module: beat … setup: … output: … |
In addition, in the project repository you’ll find:
- the complete config file
- the complete docker-compose.yml file
Monitor Elastic Stack with Metricbeat
All services described in this article are run with Docker Compose and use the following default environment variables:
|
1 2 3 4 5 6 |
# .env ELASTIC_STACK_VERSION=7.7.0 ELASTIC_USER=elastic ELASTIC_PASSWORD=test ELASTIC_HOST=elasticsearch:9200 … |
Get metrics from Elasticsearch
- Enable collection of monitoring data by setting the
xpack.monitoring.collection.enabledoption totruein thedocker-compose.ymlfile:
|
1 2 3 4 5 6 |
# docker-compose.yml … elasticsearch: environment: xpack.monitoring.collection.enabled: "true" … |
- Enable and set up the
elasticsearchmodule in themetricbeatconfiguration:
|
1 2 3 4 5 6 7 8 9 10 11 |
# metricbeat/metricbeat.yml … modules: - module: elasticsearch metricsets: ["node_stats", "index", "index_recovery", "index_summary", "shard", "ml_job", "ccr", "enrich", "cluster_stats"] period: 10s hosts: ["${ELASTIC_HOST}"] username: "${ELASTIC_USER}" password: "${ELASTIC_PASSWORD}" xpack.enabled: "true" … |
Get metrics from Kibana
- Disable the default metrics collection by setting the
monitoring.kibana.collection.enabledoption tofalsein thedocker-compose.ymlfile (written in capital letters with underscores as separators):
|
1 2 3 4 5 6 |
# docker-compose.yml … kibana: environment: MONITORING_KIBANA_COLLECTION_ENABLED: "false" … |
- Enable and set up the
kibanamodule in themetricbeatconfiguration:
|
1 2 3 4 5 6 7 8 9 10 |
# metricbeat/metricbeat.yml … - module: kibana metricsets: ["stats"] period: 10s hosts: ["kibana:5601"] username: "${ELASTIC_USER}" password: "${ELASTIC_PASSWORD}" xpack.enabled: true … |
Get metrics from Logstash
- Disable the default metrics collection by setting the
monitoring.enabledoption tofalsein thedocker-compose.ymlfile:
|
1 2 3 4 5 6 |
# docker-compose.yml … logstash: environment: MONITORING_ENABLED: "false" … |
- Enable and set up the
logstashmodule in themetricbeatconfiguration:
|
1 2 3 4 5 6 7 8 9 10 |
# metricbeat/metricbeat.yml … - module: logstash metricsets: ["node", "node_stats"] period: 10s hosts: ["logstash:9600"] username: "${ELASTIC_USER}" password: "${ELASTIC_PASSWORD}"Docker xpack.enabled: true … |
- Optional: if you don’t send data from logstash directly to an elasticsearch node, the logstash metrics will be displayed in the
Standalone cluster. Read the Get rid of the Standalone cluster in Kibana monitoring dashboard post if you want to change that.
Get metrics from Filebeat
- Disable the default metrics collection by setting the
monitoring.enabledoption tofalseand allow external collection of monitoring data by enabling the HTTP endpoint in thefilebeat.ymlfile (documentation):
|
1 2 3 4 5 6 7 8 9 10 11 |
# filebeat.yml filebeat: inputs: … output: … monitoring: enabled: "false" http: enabled: "true" host: "filebeat" |
- Enable and set up the
beatmodule in themetricbeatconfiguration:
|
1 2 3 4 5 6 7 8 9 10 |
# metricbeat/metricbeat.yml … - module: beat metricsets: ["stats", "state"] period: 10s hosts: ["filebeat:5066"] username: "${ELASTIC_USER}" password: "${ELASTIC_PASSWORD}" xpack.enabled: true … |
- Optional: if you don’t send data from filebeat directly to an elasticsearch node, the filebeat metrics will be displayed in the
Standalone cluster. Read the Get rid of the Standalone cluster in Kibana monitoring dashboard post if you want to change that.
Define output for collected metrics
Finally, we can configure the output for collected metrics. In this example project we’re using only a single Elasticsearch node. Therefore, we’re going to send the monitoring data there as well:
|
1 2 3 4 5 6 7 |
# metricbeat/metricbeat.yml … output: elasticsearch: hosts: ["${ELASTIC_HOST}"] username: "${ELASTIC_USER}" password: "${ELASTIC_PASSWORD}" |
Display metrics in a Kibana dashboard
To view monitoring data in a Kibana dashboard we have to use the following code:
|
1 2 3 4 5 6 7 |
# metricbeat/metricbeat.yml … setup: dashboards.enabled: true kibana: host: "kibana:5601" … |
By default, the data will be collected from the cluster specified in the elasticsearch.hosts value in the kibana.yml file – the project uses the default elasticsearch:9200 value which works with our one Elasticsearch node. However, if you run a dedicated cluster for monitoring, don’t forget to set monitoring.ui.elasticsearch.hosts option for the kibana service.
Use a custom Metricbeat image to configure monitoring Elastic Stack
We want to start our metricbeat service in a Docker container. Therefore, we’re going to add the metricbeat service to the Elastic Stack services that were already defined in the docker-compose.yml file. Remember to provide all environment variables that we used in the metricbeat.yml file (the KIBANA_URL is used in our custom entrypoint for this container):
|
1 2 3 4 5 6 7 8 9 10 11 12 13 14 15 16 17 18 19 20 21 22 23 |
# docker-compose.yml … metricbeat: build: context: ./metricbeat args: ELASTIC_STACK_VERSION: $ELASTIC_STACK_VERSION environment: ELASTIC_USER: $ELASTIC_USER ELASTIC_PASSWORD: $ELASTIC_PASSWORD ELASTIC_HOST: $ELASTIC_HOST KIBANA_URL: "kibana:5601" networks: - internal depends_on: - elasticsearch - logstash - filebeat - kibana networks: internal: … |
As you can see, the context for this build is expected in the metricbeat directory. We want to apply our custom configuration from the metricbeat.yml file and make sure that the metricbeat service will wait for the kibana service. With this purpose in mind, let’s create the following Dockerfile:
|
1 2 3 4 5 6 7 8 9 10 11 |
# metricbeat/Dockerfile ARG ELASTIC_STACK_VERSION FROM docker.elastic.co/beats/metricbeat:${ELASTIC_STACK_VERSION} COPY metricbeat.yml /usr/share/metricbeat/metricbeat.yml COPY wait-for-kibana.sh /usr/share/metricbeat/wait-for-kibana.sh USER root RUN chown root:metricbeat /usr/share/metricbeat/metricbeat.yml RUN chmod go-w /usr/share/metricbeat/metricbeat.yml USER metricbeat ENTRYPOINT ["sh", "/usr/share/metricbeat/wait-for-kibana.sh"] CMD ["-environment", "container"] |
- In conclusion, we copy our custom config to the container and set the proper privileges to this file.
- Furthermore, this image uses the wait-for-kibana.sh script which ensures that the
metricbeatservice will be started only afterkibanais ready. The KIBANA_URL variable provided in thedocker-compose.ymlfile is required for this script to work. You can read about this part of configuration in the How to make one Docker container wait for another post.
Verify whether Elastic stack monitoring works
At last, we can run all services defined in the docker-compose.yml file with the following command:
|
1 |
$ docker-compose up -d |
Above all, wait until the metricbeat service connects to Kibana. You can see the containers by running the $docker ps command in the command line. The output should contain the following information:
|
1 2 3 4 5 6 7 |
IMAGE PORTS NAMES elasticsearch:7.7.0 0.0.0.0:9200->9200/tcp, 9300/tcp springbootelasticstack_elasticsearch_1 logstash:7.7.0 0.0.0.0:5044->5044/tcp, 0.0.0.0:9600->9600/tcp springbootelasticstack_logstash_1 kibana:7.7.0 0.0.0.0:5601->5601/tcp springbootelasticstack_kibana_1 springbootelasticstack_filebeat springbootelasticstack_filebeat_1 springbootelasticstack_metricbeat springbootelasticstack_metricbeat_1 elastichq/elasticsearch-hq:latest 0.0.0.0:5000->5000/tcp springbootelasticstack_elastichq_1 |
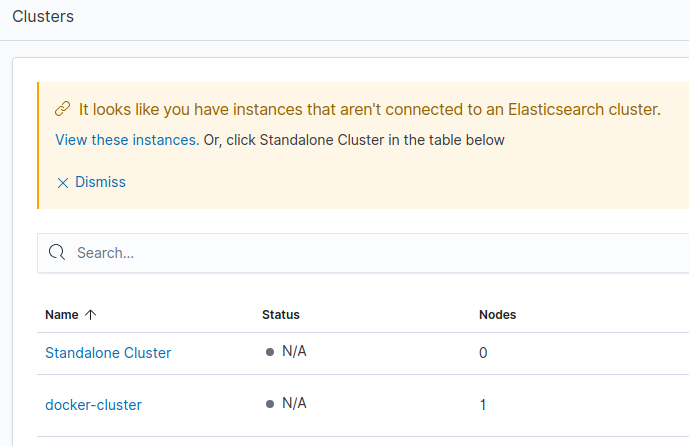
Finally, go to the http://localhost:5601/app/monitoring to see the clusters. Since our example Filebeat instance sends data to a Logstash instance, its metrics will be displayed in the Standalone cluster. Consequently, the rest of the Elastic Stack metrics are available under the docker-cluster:

In addition, read the Get rid of the Standalone cluster in Kibana monitoring dashboard post if you want to change that.
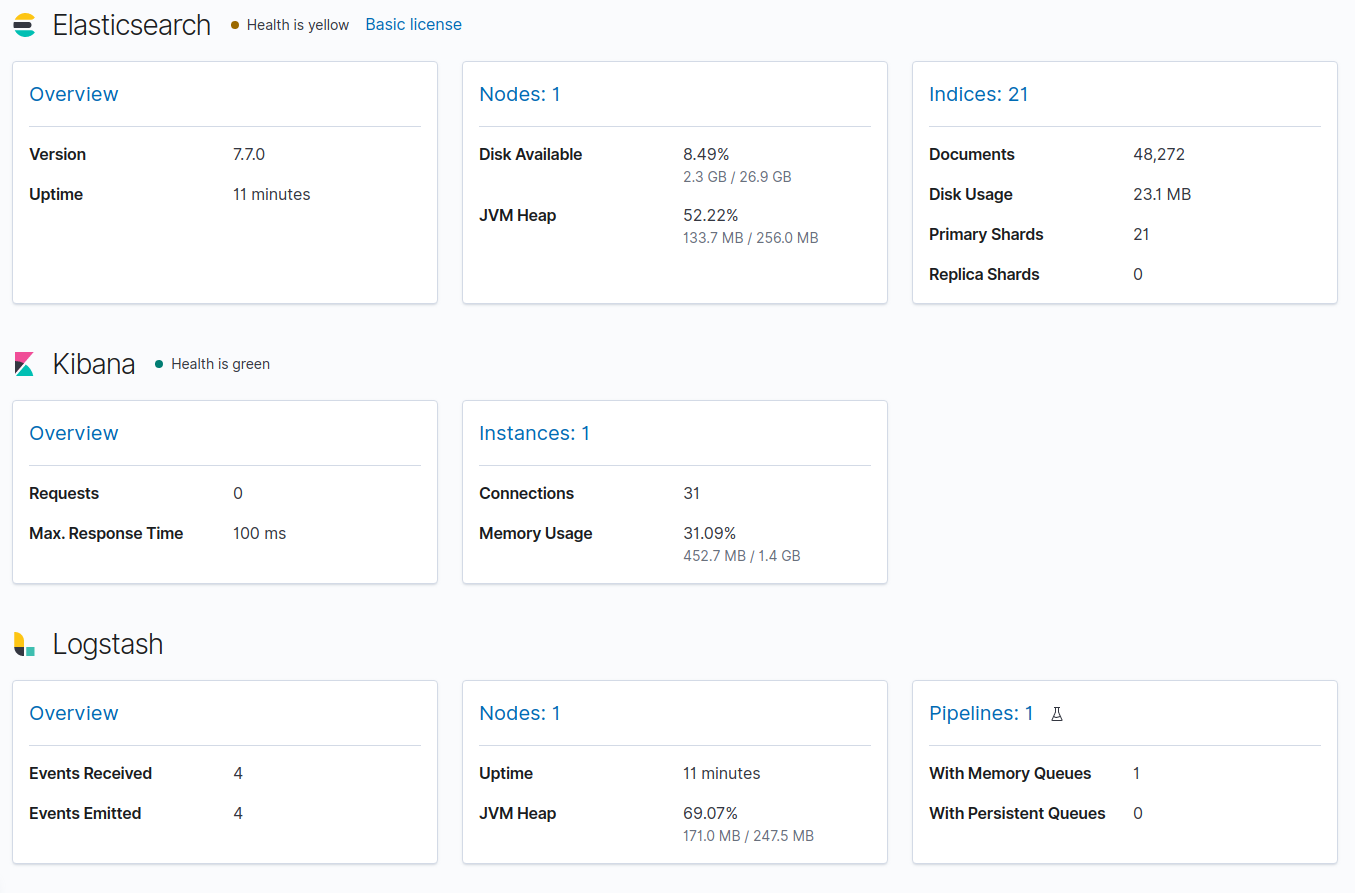
In the end, you can see the docker-cluster metrics on the image below:

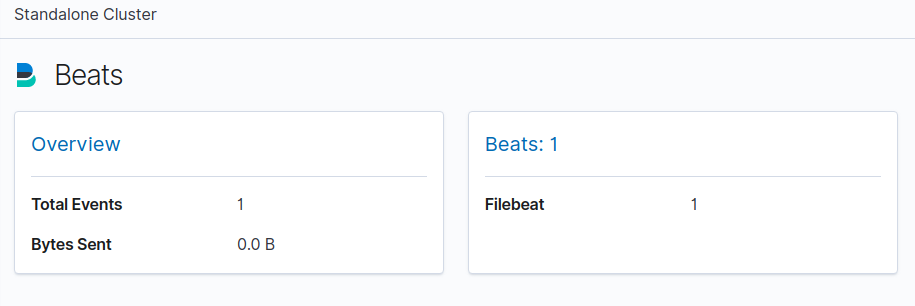
Likewise, you can see the Standalone cluster metrics on the image below:

Finally, you can find the code responsible for monitoring Elastic Stack with Metricbeat in the commit c2a6f0d082072a52f56ee3ebc49bcc30ef482b99.
Troubleshooting – when Metricbeat doesn’t monitor Elastic Stack properly
Check out this section in case something goes wrong.
Verify that your Metricbeat instance actually gets data from monitored services
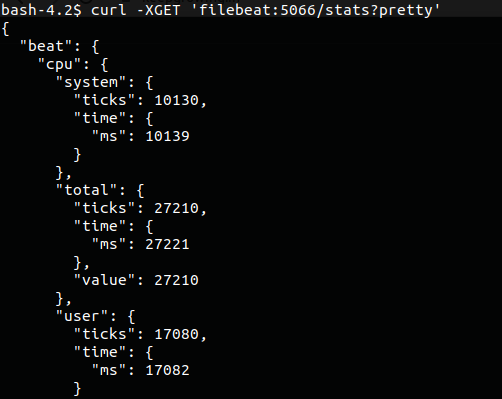
You can test Metricbeat connection to a chosen service, even when data are not shown in the Kibana dashboard. In order to achieve that, you have to enter the container and send a request to the monitored service. Let’s assume that we want to see whether the connection to the Filebeat /stats endpoint works. We can achieve this with the following commands:
|
1 2 |
$ docker exec -it springbootelasticstack_metricbeat_1 /bin/bash $ curl -XGET 'filebeat:5066/stats?pretty' |
In other words, the example correct output may look like on the screenshot below:

Specifically, if you got the Connection refused error, make sure that:
- the
http.hostandhttp.enabledoptions in thefilebeat.ymlfile are correct; - the port exposed in the
docker-compose.ymlfile for thefilebeatservice is correct.
Collect proper metricsets
Secondly, if we list the metricsets that are not compatible with the config we can get the error similar to the following one caused by wrong metricsets applied in the elasticsearch module configuration:
|
1 |
ERROR instance/beat.go:932 Exiting: The elasticsearch module with xpack.enabled: true must have metricsets: [ccr enrich cluster_stats index index_recovery index_summary ml_job node_stats shard] |
Fortunately, all required and supported metricsets are listed in the error message. Thanks to that, we know that the elasticsearch module configuration shown below collects correct metricsets:
|
1 2 3 4 5 6 |
# metricbeat/metricbeat.yml metricbeat: modules: - module: elasticsearch metricsets: ["node_stats", "index", "index_recovery", "index_summary", "shard", "ml_job", "ccr", "enrich", "cluster_stats"] … |
Verify permissions to the config file
What’s more, when the permission to the metricbeat.yml file used in the container are invalid, we’ll get the following error:
|
1 |
Exiting: error loading config file: config file ("metricbeat.yml") can only be writable by the owner but the permissions are "-rw-rw-r--" (to fix the permissions use: 'chmod go-w /usr/share/metricbeat/metricbeat.yml') |
Of course, it can be fixed by applying the correct permissions to the metricbeat.yml file in the Dockerfile for the metricbeat service:
|
1 2 3 4 5 6 7 8 9 |
# metricbeat/Dockerfile … COPY metricbeat.yml /usr/share/metricbeat/metricbeat.yml … USER root RUN chown root:metricbeat /usr/share/metricbeat/metricbeat.yml RUN chmod go-w /usr/share/metricbeat/metricbeat.yml USER metricbeat … |
Provide credentials used in the Elasticsearch node
Lastly, if you enabled Elasticsearch security features, make sure that you pass the proper Elasticsearch credentials to Metricbeat and Kibana services. Otherwise, Metricbeat won’t be able to send monitoring data and Kibana won’t be able to read them. Take note, that the environment variables for Elasticsearch username and password in Kibana have slightly different names than the ones used in the other elements of the Elastic Stack:
|
1 2 3 4 5 6 7 8 9 10 11 12 |
# docker-compose.yml … kibana: environment: ELASTICSEARCH_USERNAME: $ELASTIC_USER ELASTICSEARCH_PASSWORD: $ELASTIC_PASSWORD … metricbeat: environment: ELASTIC_USER: $ELASTIC_USER ELASTIC_PASSWORD: $ELASTIC_PASSWORD … |
Monitor Elastic Stack in a production environment
To sum up, in this article we used only one Elasticsearch node for storing business and monitoring data. However, remember to use a separate cluster for metrics in a production environment, as stated in the docs:
In production, you should send monitoring data to a separate monitoring cluster so that historical data is available even when the nodes you are monitoring are not.
https://www.elastic.co/guide/en/elasticsearch/reference/current/monitoring-production.html
In production, we strongly recommend using a separate monitoring cluster. Using a separate monitoring cluster prevents production cluster outages from impacting your ability to access your monitoring data. It also prevents monitoring activities from impacting the performance of your production cluster. For the same reason, we also recommend using a separate Kibana instance for viewing the monitoring data.
https://www.elastic.co/guide/en/elasticsearch/reference/current/monitoring-overview.html
Learn more on how to monitor Elastic Search using Metricbest
- Collecting Elasticsearch monitoring data with Metricbeat
- Collect Kibana monitoring data with Metricbeat
- Collect Logstash monitoring data with Metricbeat
- Use Metricbeat to send monitoring data from Filebeat
- Configure the Elasticsearch output for data collected with Metricbeat
- View monitoring data in Kibana
- Monitoring in a production environment
- Furthermore, you can Use Metricbeat to send monitoring data from Metricbeat
- At any rate, you can learn how to Get rid of the Standalone cluster in Kibana monitoring dashboard
- Additionally, read the How to make one Docker container wait for another post
Photo by Lechon Kirb on StockSnap

What if I have an actual cluster of Elasticsearch nodes? Can I monitor all nodes with a single Metricbeat instance?
The documentation seems to suggest you need a Metricbeat instance for each ES node:
“Install Metricbeat on each Elasticsearch node in the production cluster. Failure to install on each node may result in incomplete or missing results.”
https://www.elastic.co/guide/en/elasticsearch/reference/current/configuring-metricbeat.html