
Kibana allows us to browse data indexed in Elasticsearch nodes. We’re going to run Kibana in a Docker container and set up its configuration so it displays logs from our example Spring Boot app.
What we are going to build
We’re going to work with the example project described in the Processing logs with Elastic Stack #1 – parse and send various log entries to Elasticsearch post. The Elastic Stack applications are run as Docker services. Meanwhile, you can find the project in the spring-boot-log4j-2-scaffolding repository.
Kibana configuration with Docker Compose
We’re going to configure our kibana service with environment variables. If you need more customized config, use the kibana.yml file – check out the available settings and the bind-mounted configuration in the documentation. You can see our example configuration added to the docker-compose.yml file below:
|
1 2 3 4 5 6 7 8 9 10 11 12 13 14 15 16 |
# docker-compose.yml … services: … kibana: image: kibana:$ELASTIC_STACK_VERSION environment: ELASTICSEARCH_USERNAME: $ELASTIC_USER ELASTICSEARCH_PASSWORD: $ELASTIC_PASSWORD ports: - "5601:5601" networks: - internal depends_on: - logstash … |
I’m using the default variables stored in the .env file:
|
1 2 3 4 5 |
# .env ELASTIC_STACK_VERSION=7.7.0 ELASTIC_USER=elastic ELASTIC_PASSWORD=test … |
Set up credentials
Environment variables for credentials in Elasticsearch are:
- ELASTIC_USER,
- ELASTIC_PASSWORD.
In Kibana they are called:
- ELASTICSEARCH_USERNAME,
- ELASTICSEARCH_PASSWORD.
Using incorrect variable names will result in the following WARNING:
|
1 |
License information could not be obtained from Elasticsearch due to [security_exception] missing authentication credentials for REST request |
In the end you’ll get the following ERROR:
|
1 |
Unable to retrieve version information from Elasticsearch node |
Write environment variables correctly
Make sure that all environment variables in your docker-compose.yml file are written in capital letters with underscores as separators. As it’s stated in the documentation:
When the container starts, a helper process checks the environment for variables that can be mapped to Kibana command-line arguments. (…) The helper translates these names to valid Kibana setting names.
https://www.elastic.co/guide/en/kibana/current/docker.html#environment-variable-config
Therefore, write ELASTICSEARC_PASSWORD instead of elasticsearch.password. The helper will map your variable name to the appropriate value from the settings.
Verify whether you use the default Elasticsearch host
If you run Elasticsearch on a different host than default, don’t forget to include the ELASTICSEARCH_HOSTS variable in the docker-compose.yml.
Manual Kibana configuration
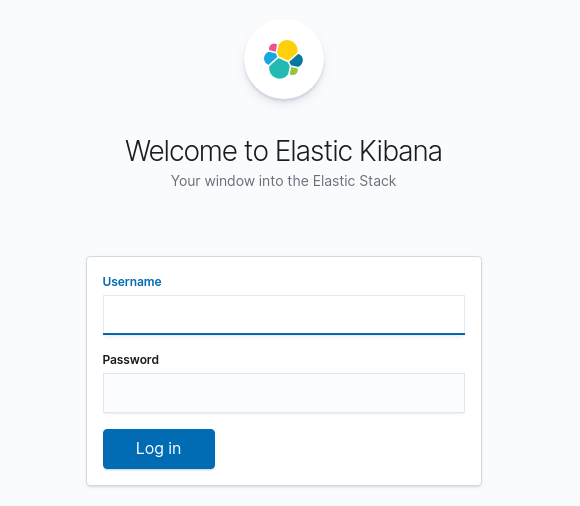
We have to complete configuration of our Kibana service manually. Go to http://localhost:5601 to log in to the app:
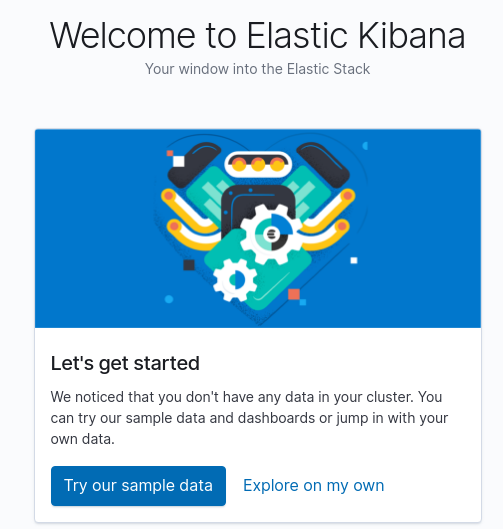
I already have some data in my Elasticsearch service as described in this post. Therefore, I’ll chose Explore on my own option from the next screen:
Create index pattern
I want to use the index I have in my Elasticsearch: “spring-boot-app-logs-%{+YYYY.MM.dd}” (defined in my logstash.conf file). Thus, I set the spring-boot-app-logs* as the Index pattern:
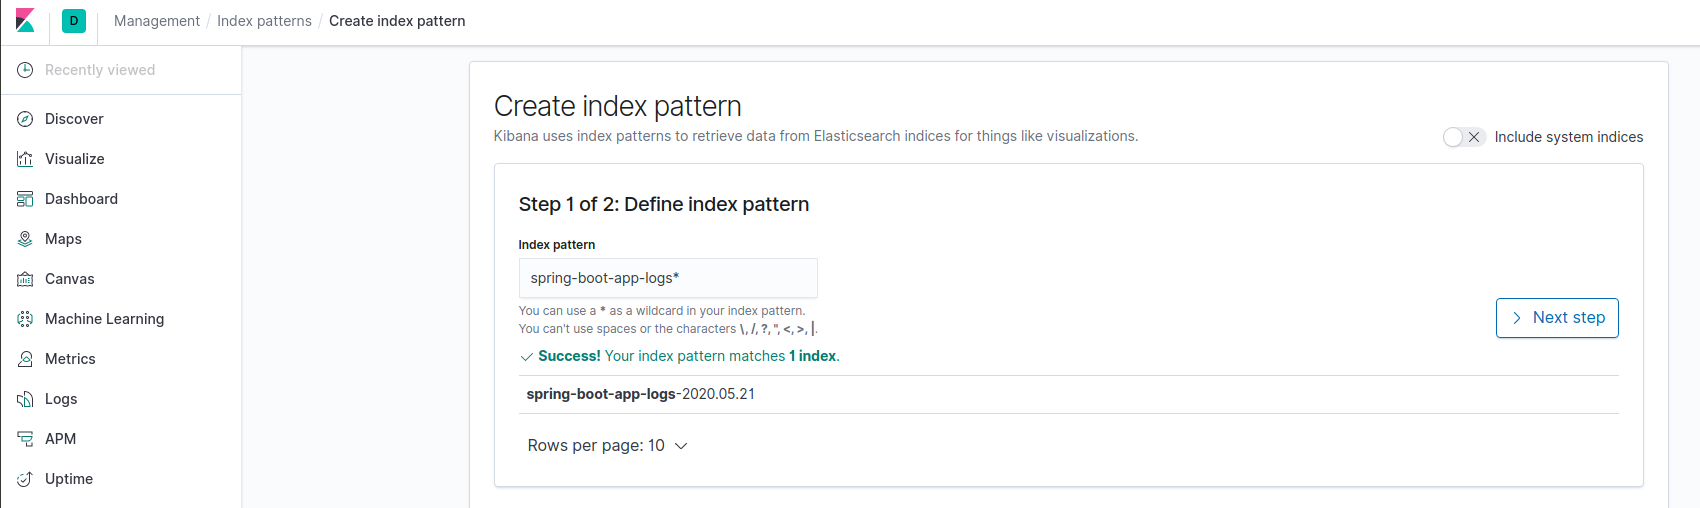
If you can’t see the Success! Your index patterns matches xx index message:
- Use ElasticHQ to see whether Elasticsearch contains your index.
- Check out the Logstash output to verify what data sets are send to Elasticsearch.
- Make sure that the log source is not empty (contains more than 1 line if you use Filebeat).
You can learn how to do all of the above in the Processing logs with Elastic Stack #1 – parse and send various log entries to Elasticsearch post.
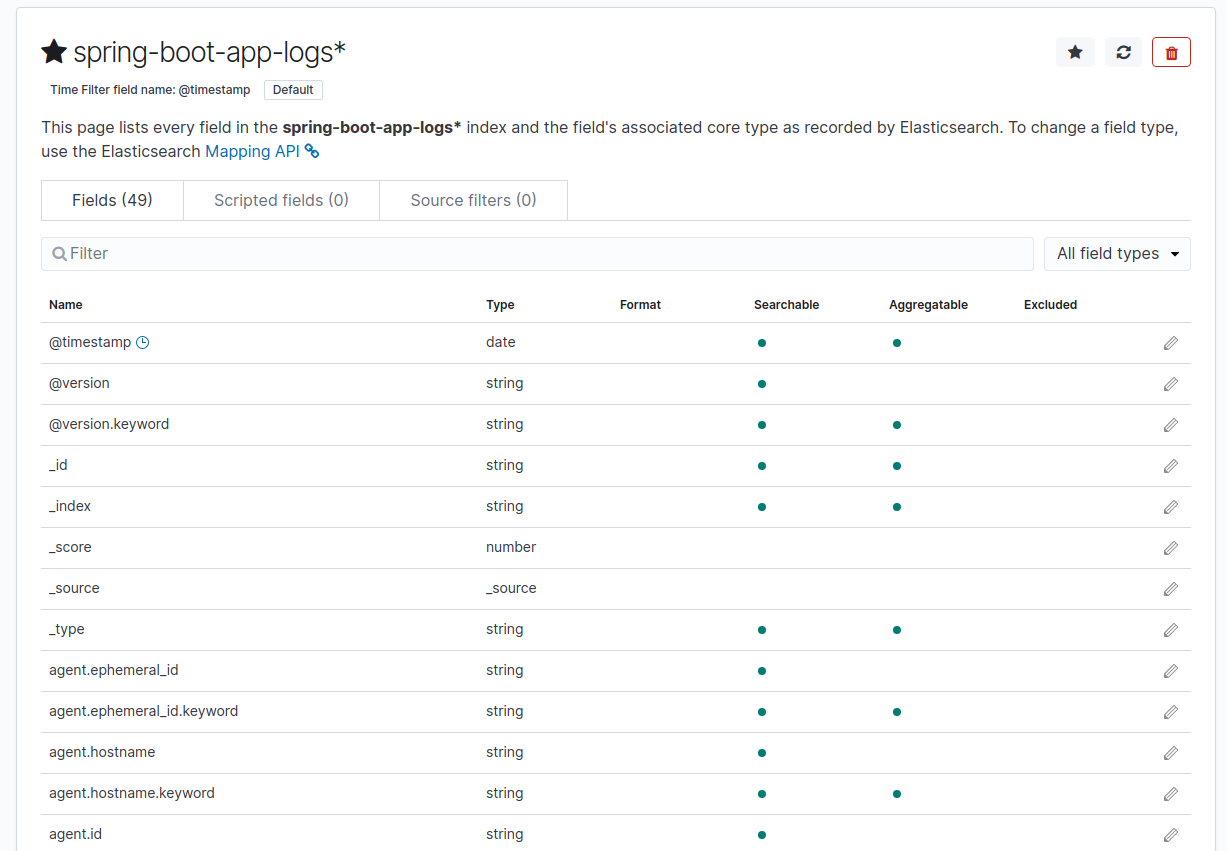
Next step requires choosing the Time filter field name – select @timestamp.
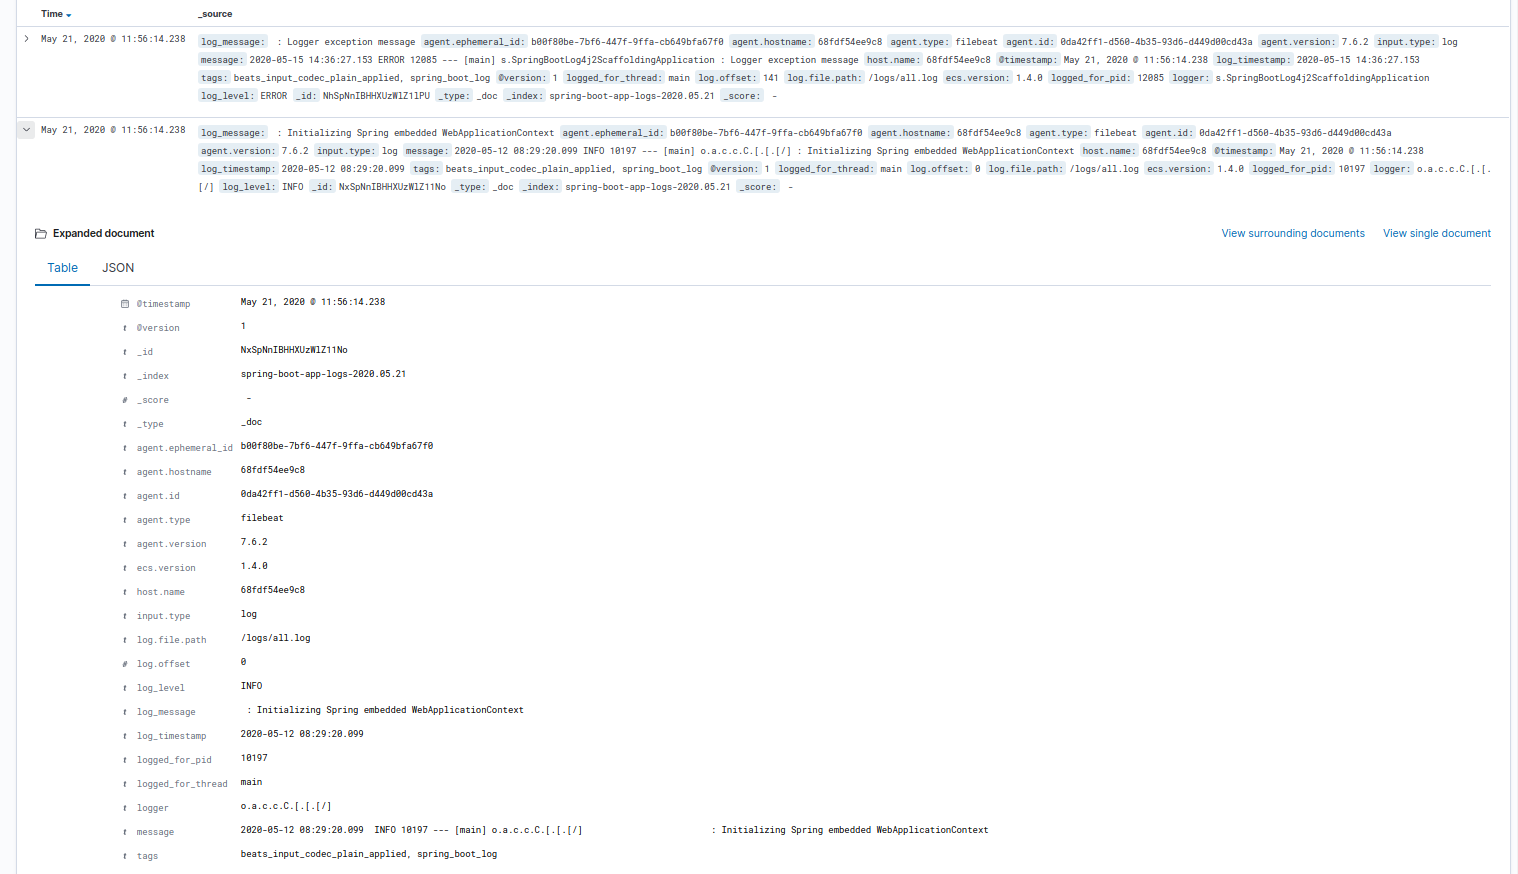
Now we can see all fields included in our index:
Browse log entries
In the Discover section, adjust the filter to see entries from the desired period:

You can easily flip through all log entries:
The work presented in this article is contained in the commit 52477331a6459bdf63a902d009d4cf190cd05b26.