
I want to show you some issues that I encountered while applying the Grok filter plugin on logs. Most of my problems resulted from overusing the GREEDYDATA pattern (.*). I tested my solutions with the Grok Debugger app where you can also find the list of available patterns.
Use already existing but redundant delimiters
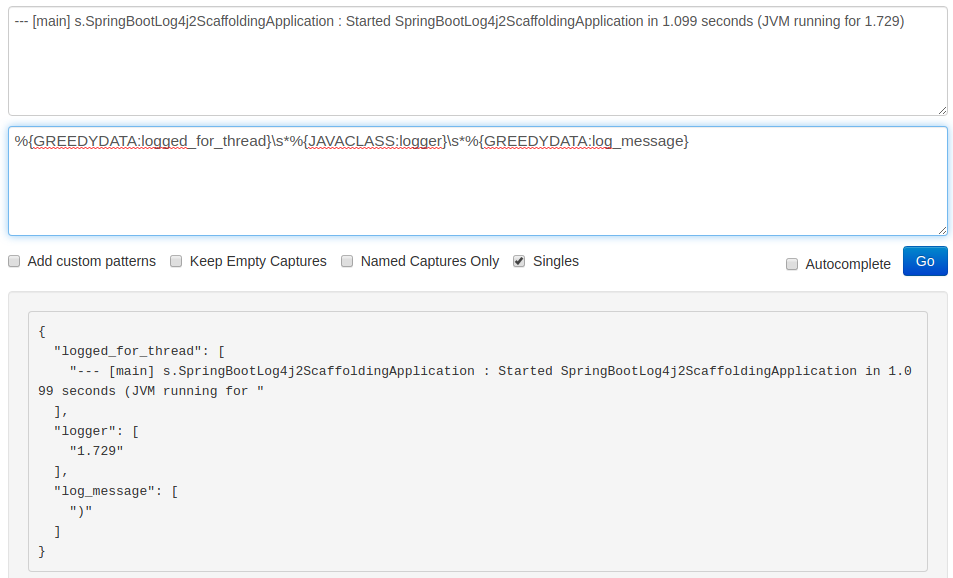
On the screenshot below you can see how using the GREEDYDATA pattern on the logged_for_thread field messed up the parsing:
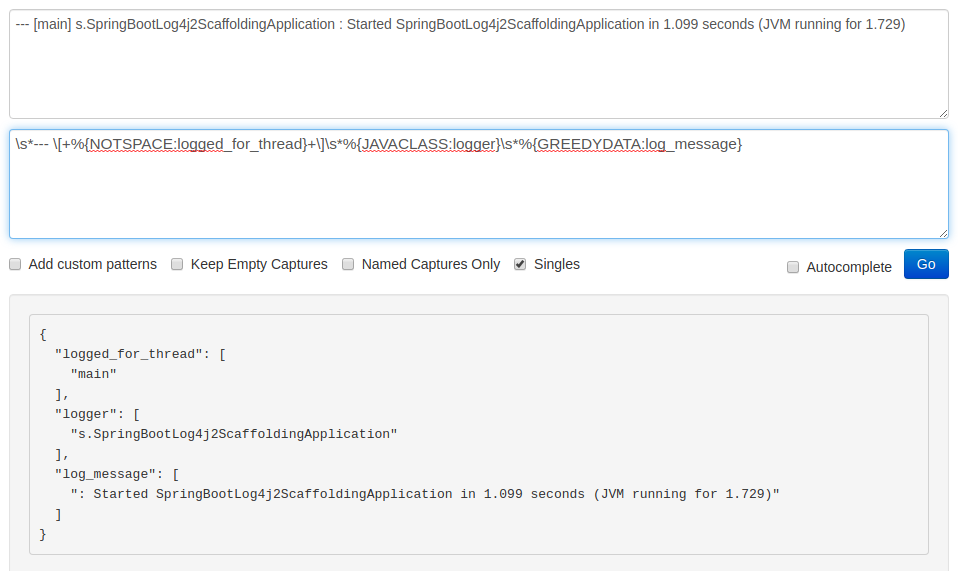
We don’t need the --- [] characters in the final result. Therefore, we can use them to explicitly pinpoint the start and end of a thread name. By including them in the pattern, we exclude them from the outcome which gives us only the actual main label. Furthermore, we can now use the NOTSPACE (\S+) pattern instead of the .* as before. You can see how it works on the following screenshot:
Enclose the misidentified part in a temporary field
We can use the JAVACLASS pattern for finding loggers:
|
1 |
(?:[a-zA-Z0-9-]+\.)+[A-Za-z0-9$]+ |
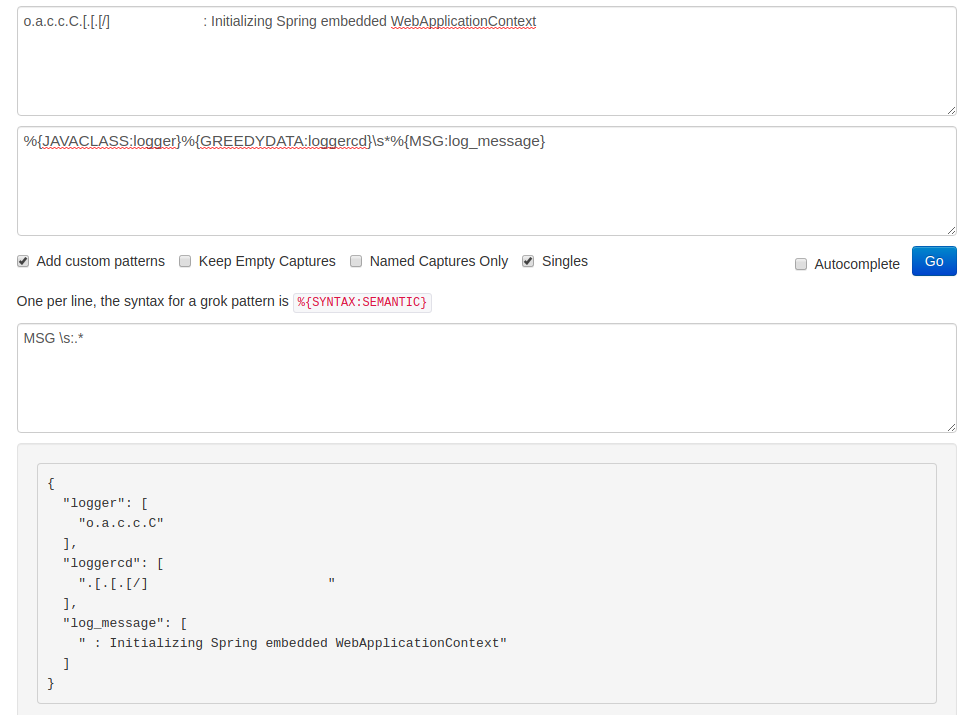
Unfortunately, it is not enough to properly identify the logger in the following example:

To solve this issue I’m going to:
- identify the
log_messagewith a custom pattern; - introduce a temporary field for the tricky part of the logger –
.[.[.[/]; - concatenate both parts of the
loggertogether; - trim whitespace;
- remove the temporary field.
Custom pattern
In my case every log_message starts with a whitespace followed by a colon. Let’s write this information as a MSG pattern in the custom.txt file:
|
1 2 |
# logstash/pipeline/patterns/custom.txt MSG \s:.* |
We can include this pattern in the logstash.conf file only after declaring the path to it in the patterns_dir option. Make sure that you use the correct path. In my example I placed this directory in the same location as the configuration file:
|
1 2 3 4 5 6 7 |
# logstash/pipeline/logstash.conf … grok { patterns_dir => ["./patterns"] match => {"message" => "… %{MSG:log_message}"} } … |
Introduce a temporary field
Now we have to deal with the troublesome .[.[.[/] part between the JAVACLASS and MSG patterns. In my case everything placed here is still part of a logger. Therefore, I’m going to identify it as the %{GREEDYDATA:loggercd} segment. We ended up with two logger parts, where the second one contains trailing whitespace:
Concatenate fields and clean up
To create a properly constructed logger field we’re going to apply the mutate filter plugin:
|
1 2 3 4 5 6 7 8 9 10 |
# logstash/pipeline/logstash.conf … if [loggercd] { mutate { replace => { "logger" => "%{logger}%{loggercd}" } strip => ["logger"] remove_field => ["loggercd"] } } … |
As you can see, we:
- started with a conditional statement because if a log entry doesn’t contain a filled
loggercdpart, we want to leave it as it is; - concatenated the
loggerandloggercdfields and replaced the original incompleteloggerfield with that value; - stripped the new value from trailing whitespace;
- removed the
loggercdfield as it fulfilled its task.
To show you the results I have to run my app this time. On the following screenshot (from my ElasticHQ instance) you can see how the original message was parsed:

You can see the example logstash.conf file (with the STDOUT output so you can easily test it yourself) below:
|
1 2 3 4 5 6 7 8 9 10 11 12 13 14 15 16 17 18 19 20 21 22 23 24 25 26 |
# logstash/pipeline/logstash.conf input { beats { port => 5044 } } filter { grok { patterns_dir => ["./patterns"] match => { "message" => "%{TIMESTAMP_ISO8601:log_timestamp}\s*%{LOGLEVEL:log_level}\s*%{POSINT:logged_for_pid}\s*--- \[+%{NOTSPACE:logged_for_thread}+\]\s*%{JAVACLASS:logger}%{GREEDYDATA:loggercd}\s*%{MSG:log_message}" } } if [loggercd] { mutate { replace => { "logger" => "%{logger}%{loggercd}" } strip => [ "logger" ] remove_field => [ "loggercd" ] } } } output { stdout { codec => rubydebug } } |
You can test it against logs that have the same structure as the entries listed below:
|
1 2 3 4 |
2020-05-12 08:31:26.530 INFO 10197 --- [SpringContextShutdownHook] o.s.s.c.ThreadPoolTaskExecutor : Shutting down ExecutorService 'applicationTaskExecutor' 2020-05-12 08:29:20.099 INFO 10197 --- [main] o.a.c.c.C.[.[.[/] : Initializing Spring embedded WebApplicationContext 2020-05-12 08:29:20.290 INFO 10197 --- [main] s.SpringBootLog4j2ScaffoldingApplication : Started SpringBootLog4j2ScaffoldingApplication in 1.099 seconds (JVM running for 1.729) 2020-05-12 08:29:20.290 ERROR 10197 --- [main] s.SpringBootLog4j2ScaffoldingApplication : Logger exception message |
Conclusion
While the example log entries I used in this article don’t exhaust the topic, they may be useful to illustrate some issues with identifying structure in any content that we want to parse with Grok.
In the end, try to restrict the usage of the .* pattern (GREEDYDATA) as much as possible and debug tricky entries. The Grok Constructor application might be helpful as well.