
Including Grafana in a monitoring stack allows us to effectively keep an eye on an application status. Project monitoring becomes much easier once we add an advanced analysing platform to display collected data in a rich set of charts. We can easily set up Grafana on our development environment using Docker Compose to test the tool.
What we’re going to build
In this article, I’m going to work with the spring-boot-log4j-2-scaffolding project where I already use Prometheus to collect data on a Spring Boot application. You can learn on how to monitor project like this in the following posts:
My end goal was to see metrics gathered by Prometheus in the Grafana JVM dashboard.
Enhance application monitoring with Grafana
Let’s see how easy it is to set up this tool on a local environment, connect it to a Prometheus server and add a dashboard with a comprehensive set of graphs.
How to set up a Grafana service with Docker Compose
In order to test Grafana on a local machine we’re going to use the official image and the following Docker Compose configuration:
|
1 2 3 4 5 6 7 8 9 10 11 12 13 14 15 16 17 18 19 20 21 22 23 24 |
# docker-compose.yml version: "3.3" services: … grafana: image: grafana/grafana:$GRAFANA_VERSION environment: GF_SECURITY_ADMIN_USER: $GRAFANA_ADMIN_USER GF_SECURITY_ADMIN_PASSWORD: $GRAFANA_ADMIN_PASSWORD ports: - 3000:3000 volumes: - grafana-storage:/var/lib/grafana depends_on: - prometheus networks: - internal … networks: internal: volumes: grafana-storage: … |
The prometheus service is already defined in the same docker-compose.yml file. Furthermore, it’s is available for the other services running within the internal network under prometheus:9090 (http://localhost:9090/ in my browser).
Consequently, we have to define default values for the environment variables. I’m going to specify them in the following .env file:
|
1 2 3 4 |
# .env GRAFANA_VERSION=7.1.3 GRAFANA_ADMIN_USER=user GRAFANA_ADMIN_PASSWORD=test |
It’s possible to configure data sources and dashboards before starting Grafana for the first time. You can learn how to do it in the Grafana provisioning – How to configure data sources and dashboards post. On the other hand, you can achieve the same results with the UI. Below you’ll find a step-by-step instruction on how to set up a data source and a dahsboard manually.
Start the grafana service
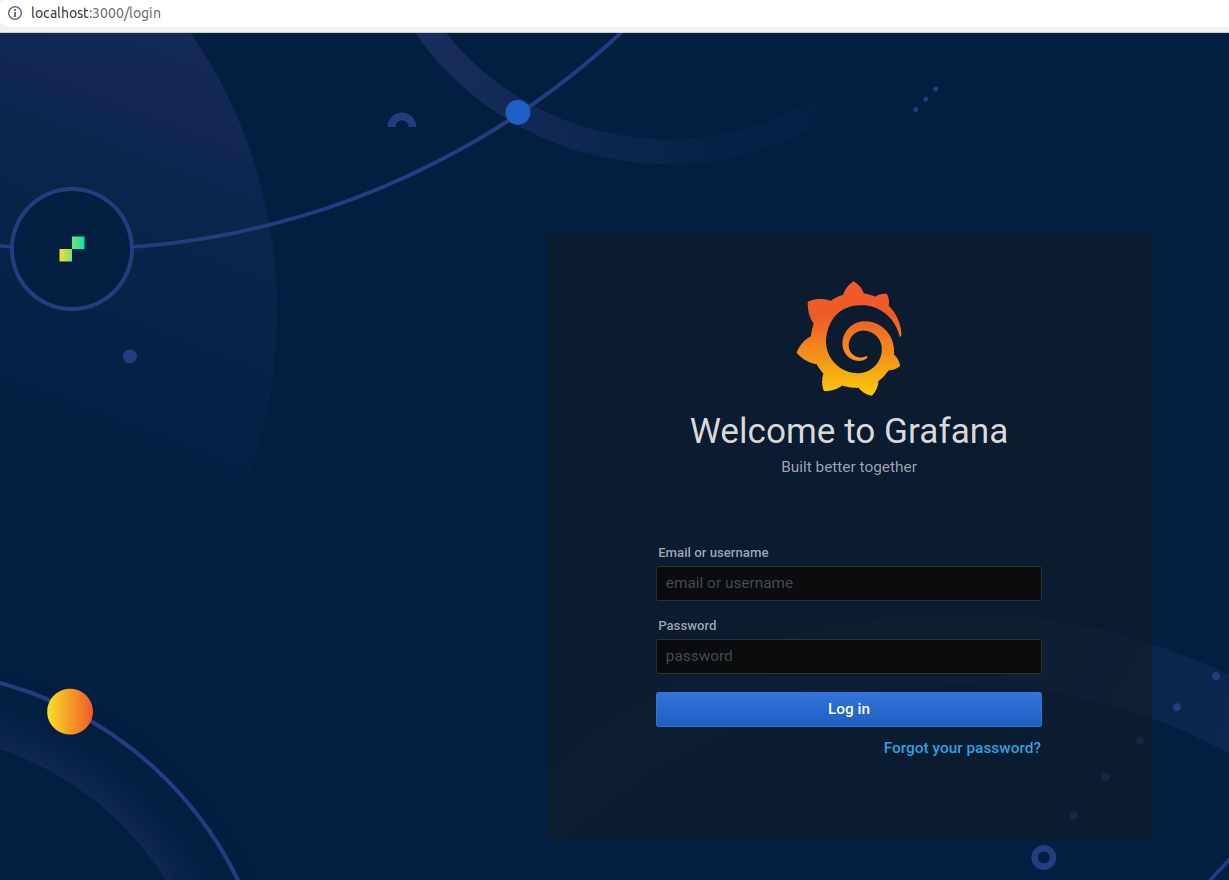
Run the service with the $docker-compose up -d grafana command and visit http://localhost:3000/ in your browser. You’ll see the login form, where you should enter the credentials specified in the container configuration. In my example I have to use my default data (from my .env file):
- username:
user, - password:
test.
However, if you start the service without setting the environment variables for admin credentials, Grafana defaults to:
- username:
admin, - password:
admin.
In this case, you’ll see a prompt to change the password as soon as you log in.
Configuring data sources manually
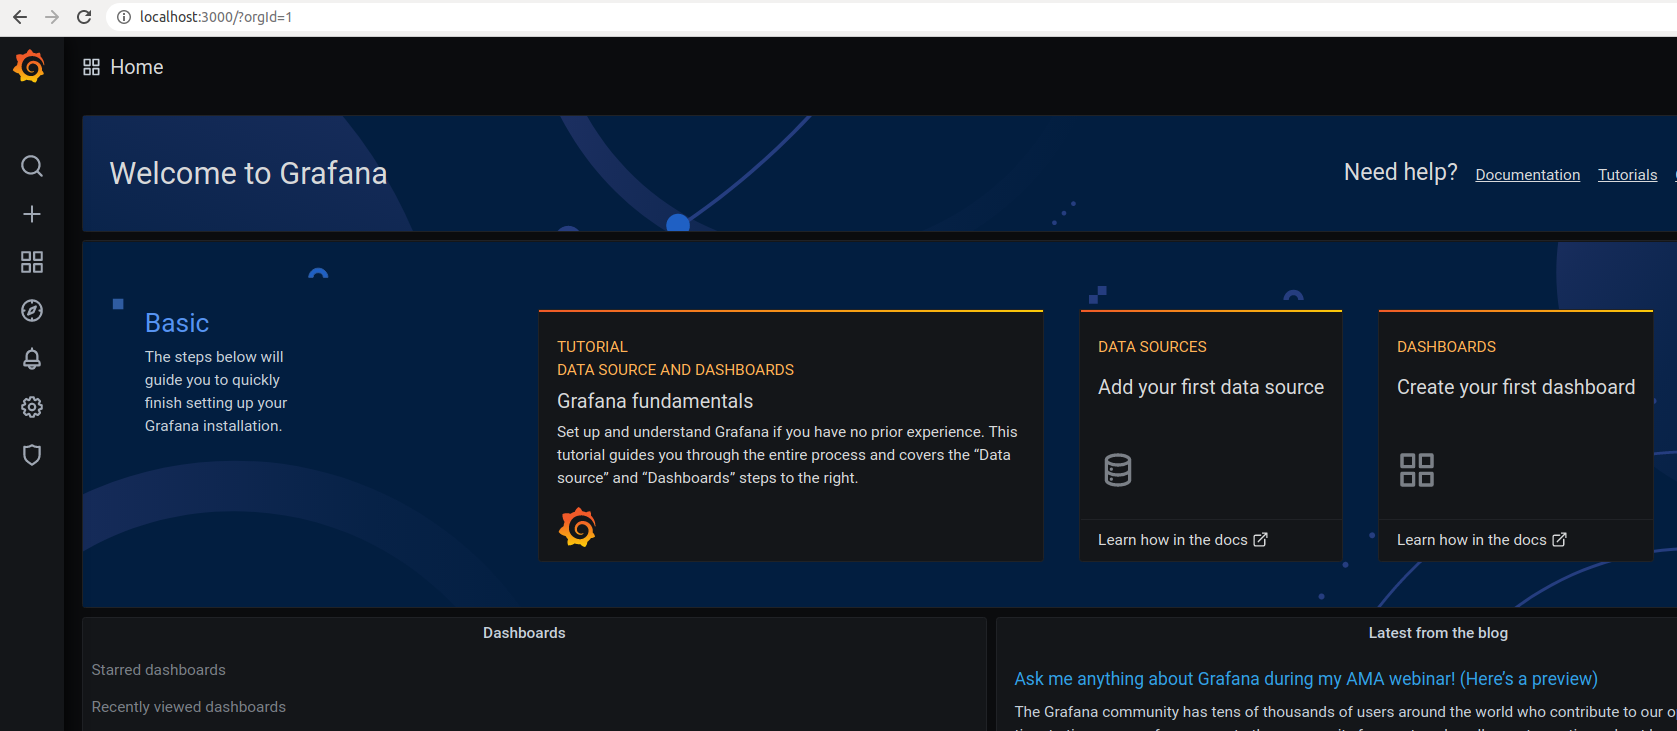
There are no monitoring data yet and the Dashboard section visible on the screenshot below has no entries.
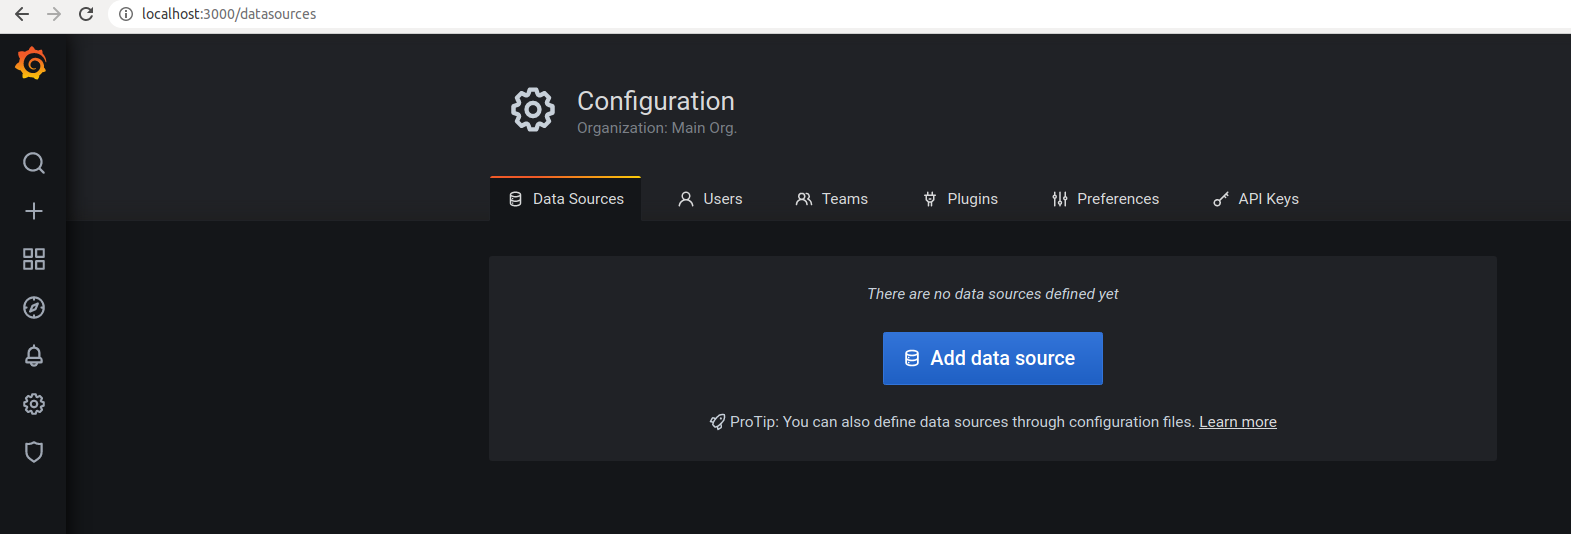
First, visit http://localhost:3000/datasources and click the Add data source button:
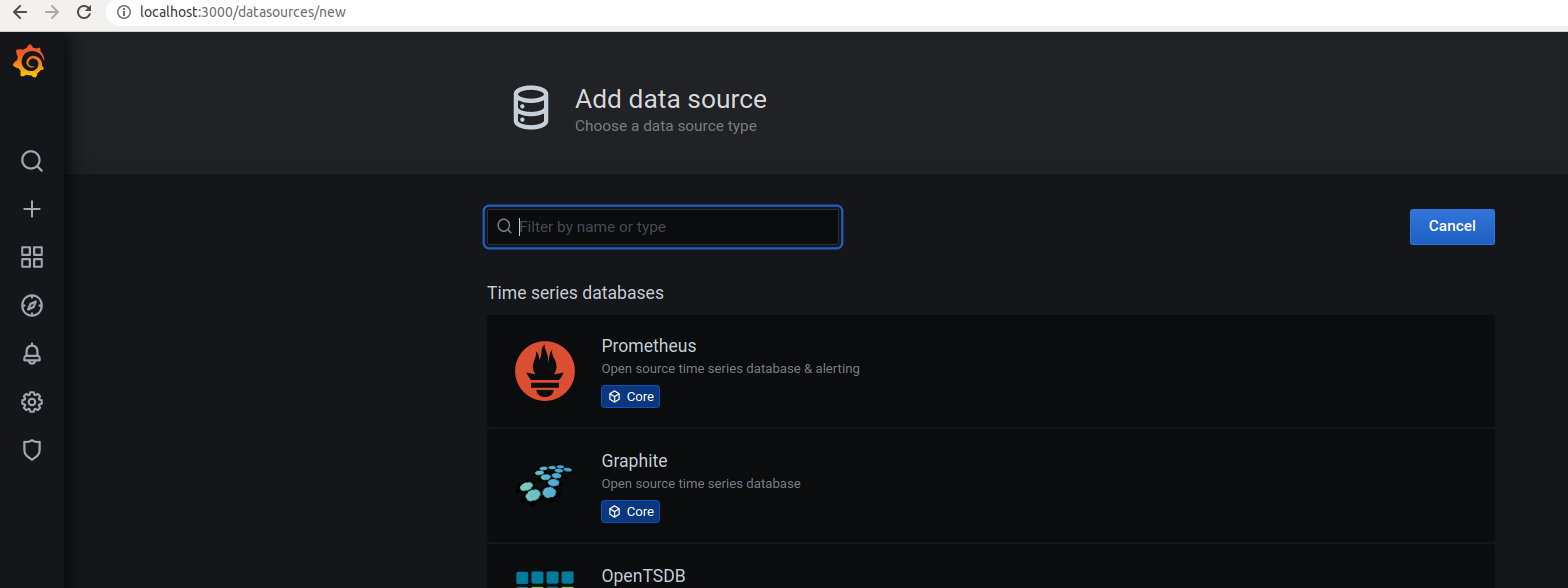
Choose one data source from the list of the supported data sources. In my case, I click Prometheus:
In the following step specify a unique name for this source, its url and the access mode:
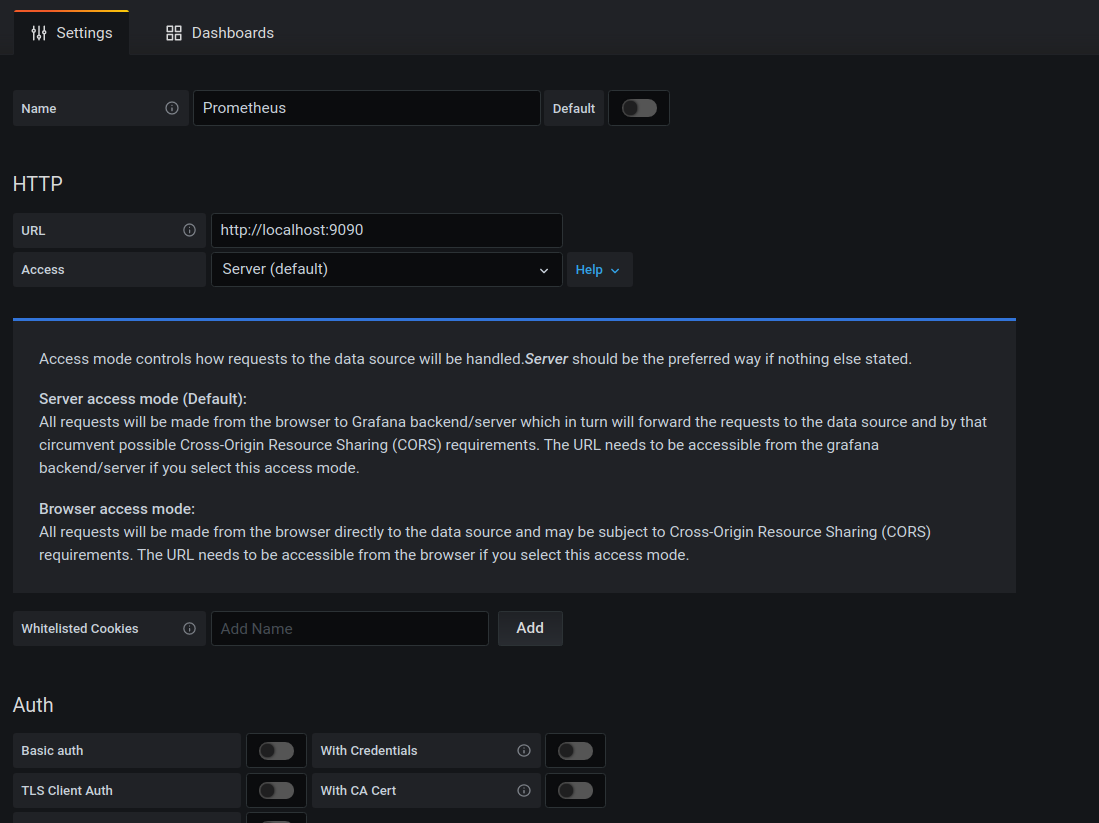
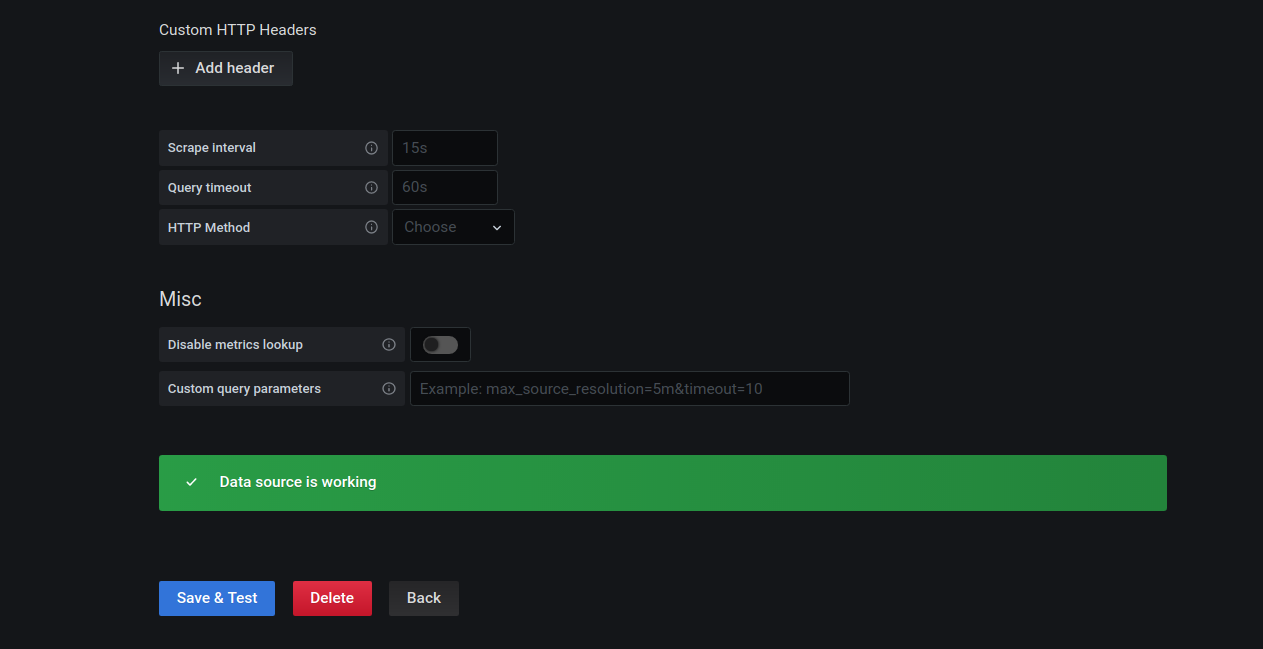
Click the Save & Test button to verify the configuration:
Apply a ready to use dashboard
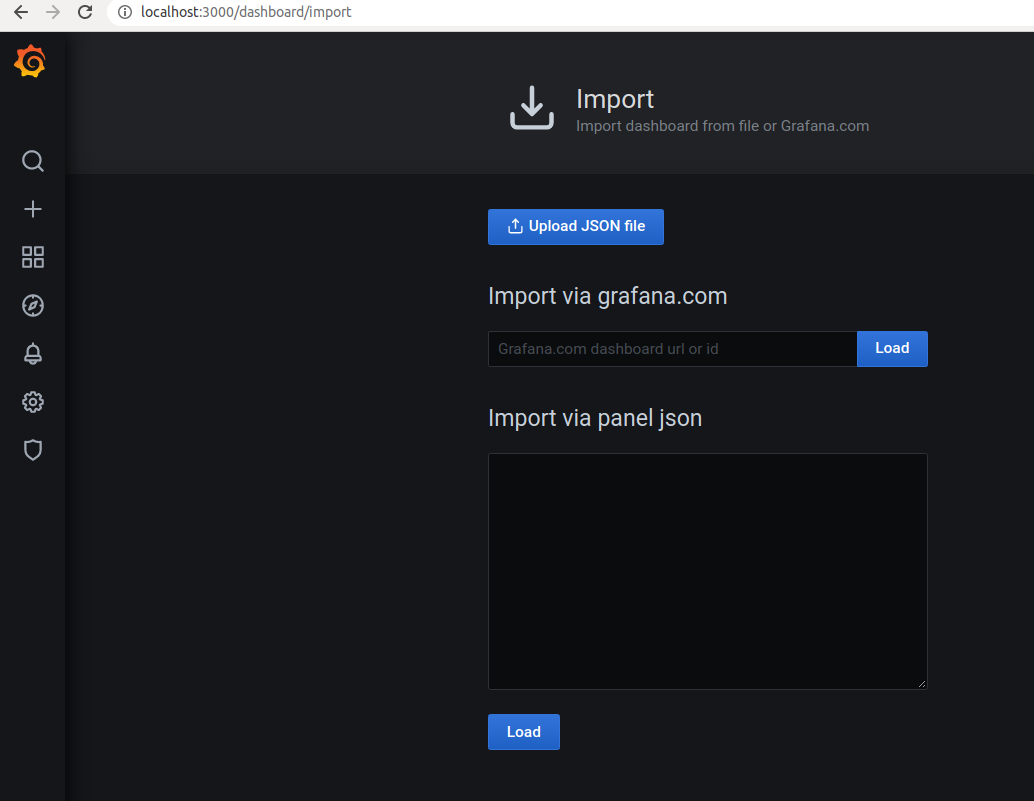
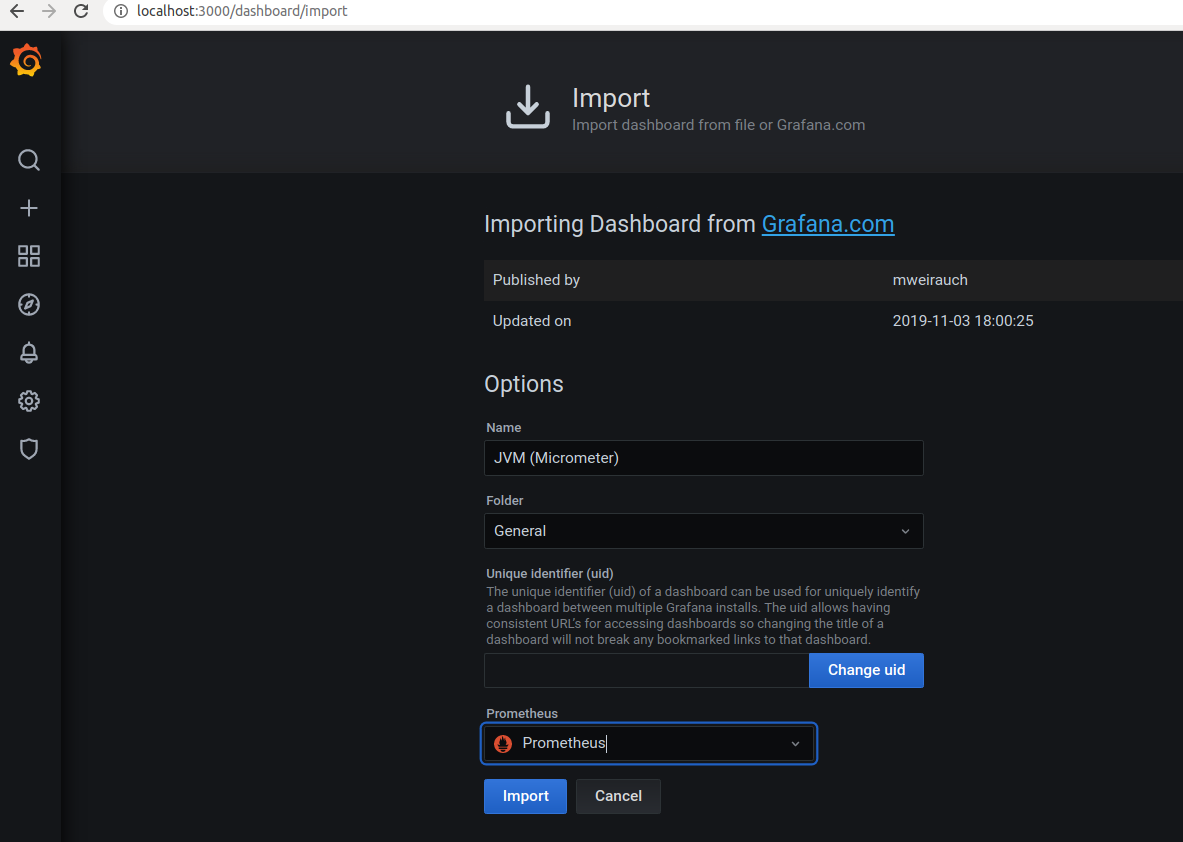
Grafana offers a rich set of predefined dashboards. For monitoring my Spring Boot project I’m going to use the JVM dashboard. Visit http://localhost:3000/dashboard/import and either upload the configuration saved as a JSON file or paste the dashboard ulr (https://grafana.com/grafana/dashboards/4701):
Next, confirm the settings by clicking the Import button:
Finally, you should be able to see the monitoring data presented in the dashboard:
More on how to set up Grafana
- Official & community built dashboards
- For more info read the Run Docker image as well as Configure a Grafana Docker image tutorials
- Configure with environment variables
- Additionally, you can try exporting and importing dashboards
- Furthermore, explore the official documentation on Adding a data source and Dashboard overview