We don’t have to manually configure data sources and dashboards for Grafana. Thanks to the Grafana provisioning feature, we can use configuration files to set up everything before running the application for the first time.
What we’re going to build
In this article, I’m going to work with the spring-boot-log4j-2-scaffolding project where I already use Prometheus to collect monitoring data on a Spring Boot application. Additionally, you can find the detailed description of applying Grafana (v7.1.3) to this project in the How to set up Grafana with Docker and connect it to Prometheus post. Remember, all applications are run with Docker Compose. Thanks to that, you can easily test the setup on your local machine.
My end goal was to be able to start Grafana with both a Prometheus data source and a dashboard (the predefined JVM dashboard instance) already configured.
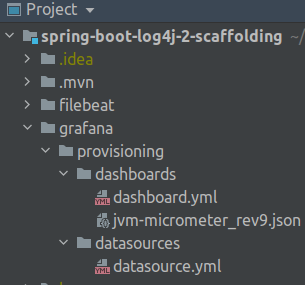
Below you can see the grafana directory containing files that I added to my project to supply Grafana configuration:
Provisioning Prometheus as a Grafana data source
According to my docker compose configuration the prometheus service is available for the other services running within the internal network under prometheus:9090 (http://localhost:9090/ in my browser).
Configure the datasource
In order to use it as a data source for Grafana, specify the minimal required configuration in the provisioning/datasources/datasource.yml file:
|
1 2 3 4 5 6 7 8 |
# grafana/provisioning/datasources/datasource.yml apiVersion: 1 datasources: - name: Prometheus type: prometheus access: proxy url: prometheus:9090 |
Remember that we can use environment variables instead of hardcoded values. Below, you’ll find a short description of used options:
name– your unique name of the data source.type– one of the officially supported data sources.url– the URL of your data source (in my case, the Prometheus server).access– access mode. You can choose eitherproxyordirect. (Server or Browser in the UI). We can learn more from the documentation:
Access mode controls how requests to the data source will be handled. Server should be the preferred way if nothing else stated.
https://github.com/grafana/grafana/pull/11531
Server access mode (Default):
All requests will be made from the browser to Grafana backend/server which in turn will forward the requests to the data source and by that circumvent possible Cross-Origin Resource Sharing (CORS) requirements. The URL needs to be accessible from the grafana backend/server if you select this access mode.
Browser access mode:
All requests will be made from the browser directly to the data source and may be subject to Cross-Origin Resource Sharing (CORS) requirements. The URL needs to be accessible from the browser if you select this access mode.
In effect, this file will configure a default data source for the default organisation in Grafana (identified with the id=1). Because of it, remember to specify the orgId option accordingly for your data sources if needed. For more detail, feel free to browse the official datasource.yml file example.
Mount the configuration to the docker container
Next, we need to mount this configuration to the grafana service. Namely, under the /etc/grafana/provisioning/datasources directory. The /etc/grafana/provisionig is the default value in Grafana Docker for the GF_PATHS_PROVISIONING variable. For this reason, edit the docker-compose.yml file to add the appropriate volume:
|
1 2 3 4 5 6 7 8 |
# docker-compose.yml … grafana: … volumes: … - ./grafana/provisioning/datasources:/etc/grafana/provisioning/datasources … |
Provisioning a predefined Grafana dashboard
We can use one of the predefined, ready to use Grafana dashboards to save time on configuration. Therefore, to display metrics gathered on my Spring Boot project, I’m going to use the „Dashboard for Micrometer instrumented applications (Java, Spring Boot, Micronaut)” i. e. the JVM dashboard.
Add the configuration to the project
First, download the JSON file using the link provided on the dashboard page:

In my case, I got the 9th revision.
Next, save the file in the grafana/provisioning/dashboards/ directory. Consequently, we need to create the dashboard.yml file in the same folder to make Grafana use our JVM dashboard config:
|
1 2 3 4 5 6 7 8 |
# grafana/provisioning/dashboards/dashboard.yml apiVersion: 1 providers: - name: 'Default' folder: 'Services' options: path: /etc/grafana/provisioning/dashboards |
Below you’ll find a short description of used options:
name– each provider has to be identified by a unique name. In my example I choseDefaultas the name of my only provider.folder– name of the dashboard folder. If you provide an empty string here, your dashboards will be displayed under theGeneralfolder. I choseServicesas the name just like it was presented in the official tutorial.path– path to dashboard files on a disk. Once again, the/etc/grafana/provisionigis the default value in Grafana Docker for the GF_PATHS_PROVISIONING variable.
Mount the configuration to the docker container
In the dashboard.yml file we specified the /etc/grafana/provisioning/dashboards as the path used by our Default provider. Therefore, we have to mount our folder to this location in the container:
|
1 2 3 4 5 6 7 8 |
# docker-compose.yml … grafana: … volumes: … - ./grafana/provisioning/dashboards:/etc/grafana/provisioning/dashboards … |
However, starting Grafana now will result in the Datasource named ${DS_PROMETHEUS} was not found error once we try to access the dashboard.
How to deal with the Datasource named ${DS_PROMETHEUS} was not found error
The issue is caused by the "datasource": "${DS_PROMETHEUS}" used in the jvm-micrometer_rev9.json file. At the moment of writing this post the issue seems to be still open. Henceforth, I simply replaced all the ${DS_PROMETHEUS} occurrences with the correct data source name – Prometheus.
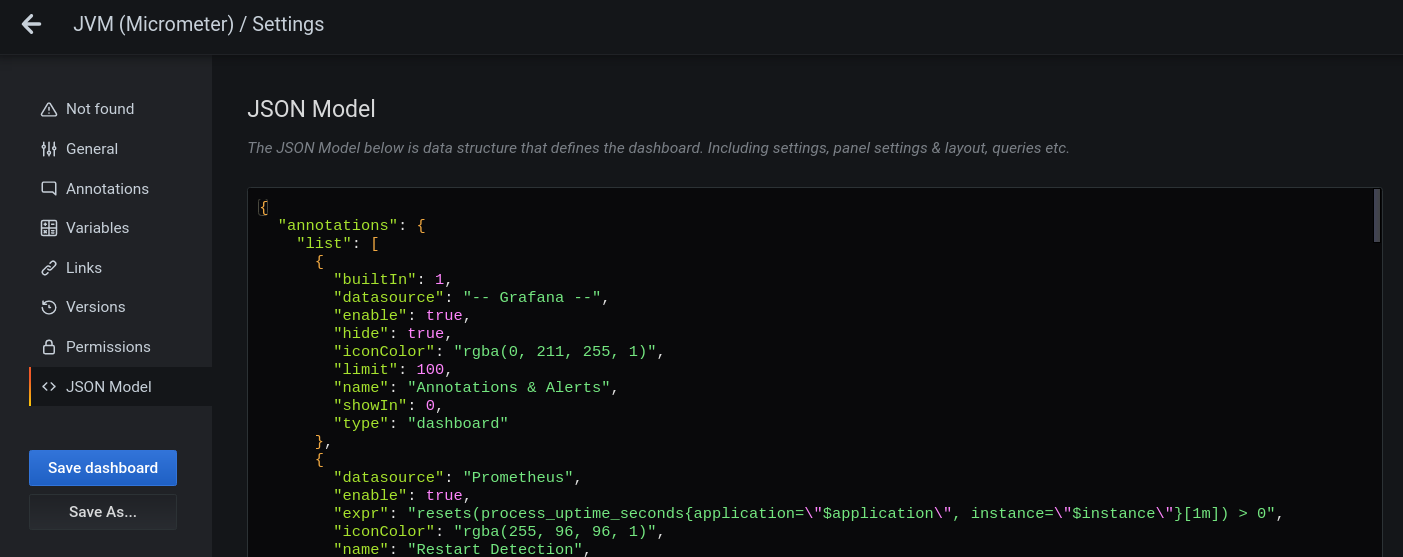
All in all, the issue occurs only when working with files downloaded from the Official and community dashboard page. In other words, you won’t have to edit the file manually if you copy the config json from a running Grafana instance that already uses the dashboard:
Verify that provisioning data sources and dahsboards was successful
Finally, if you are using my docker-compose.yml file, run the following command to start services:
|
1 |
$ docker-compose up -d app prometheus grafana |
In the grafana service logs I can see that provisioning did not generate any errors:
|
1 2 3 4 |
… lvl=info msg="Config overridden from command line" logger=settings arg="default.paths.provisioning=/etc/grafana/provisioning" … lvl=info msg="Path Provisioning" logger=settings path=/etc/grafana/provisioning |
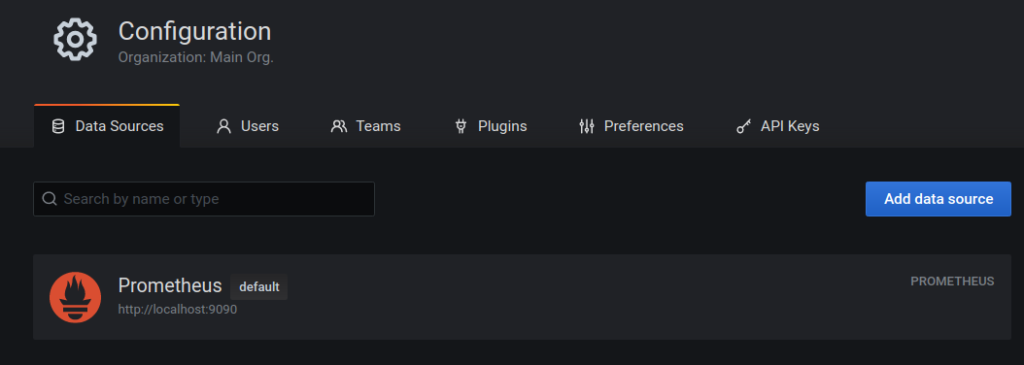
Now, we can visit http://localhost:3000/datasources to see our Prometeus data source:
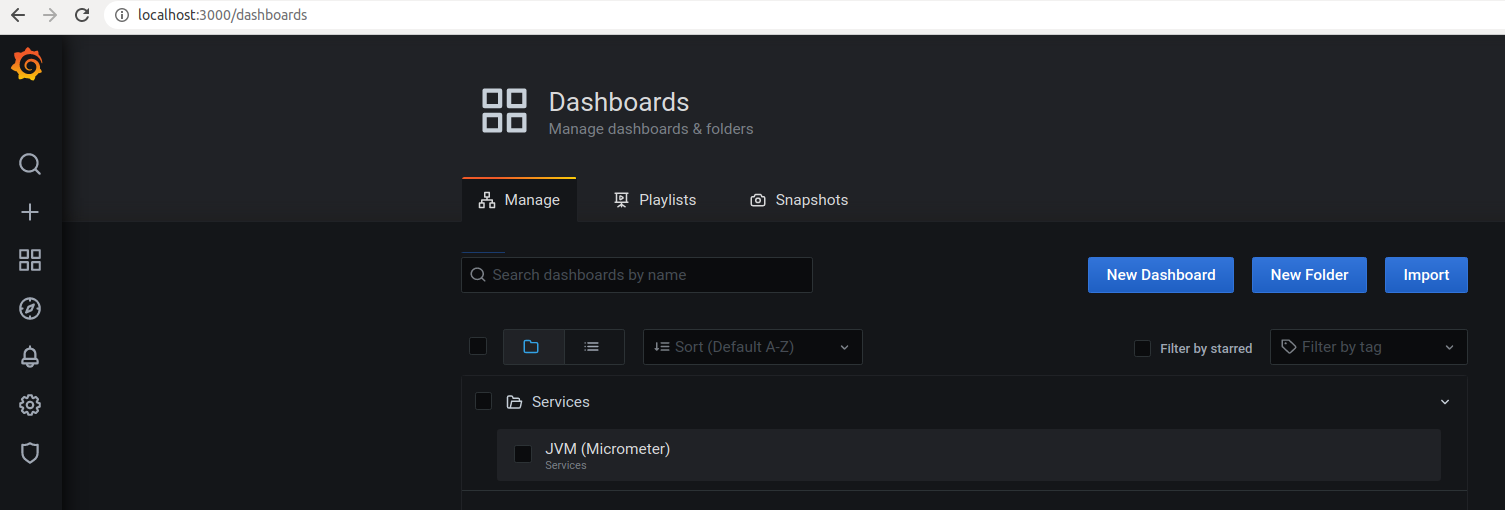
Likewise, go to http://localhost:3000/dashboards to verify that the JVM dashboard is indeed located in the Services directory as we specified in the dashboard.yml file:
Next, select the JVM (Micrometer) entry to see the dashboard:
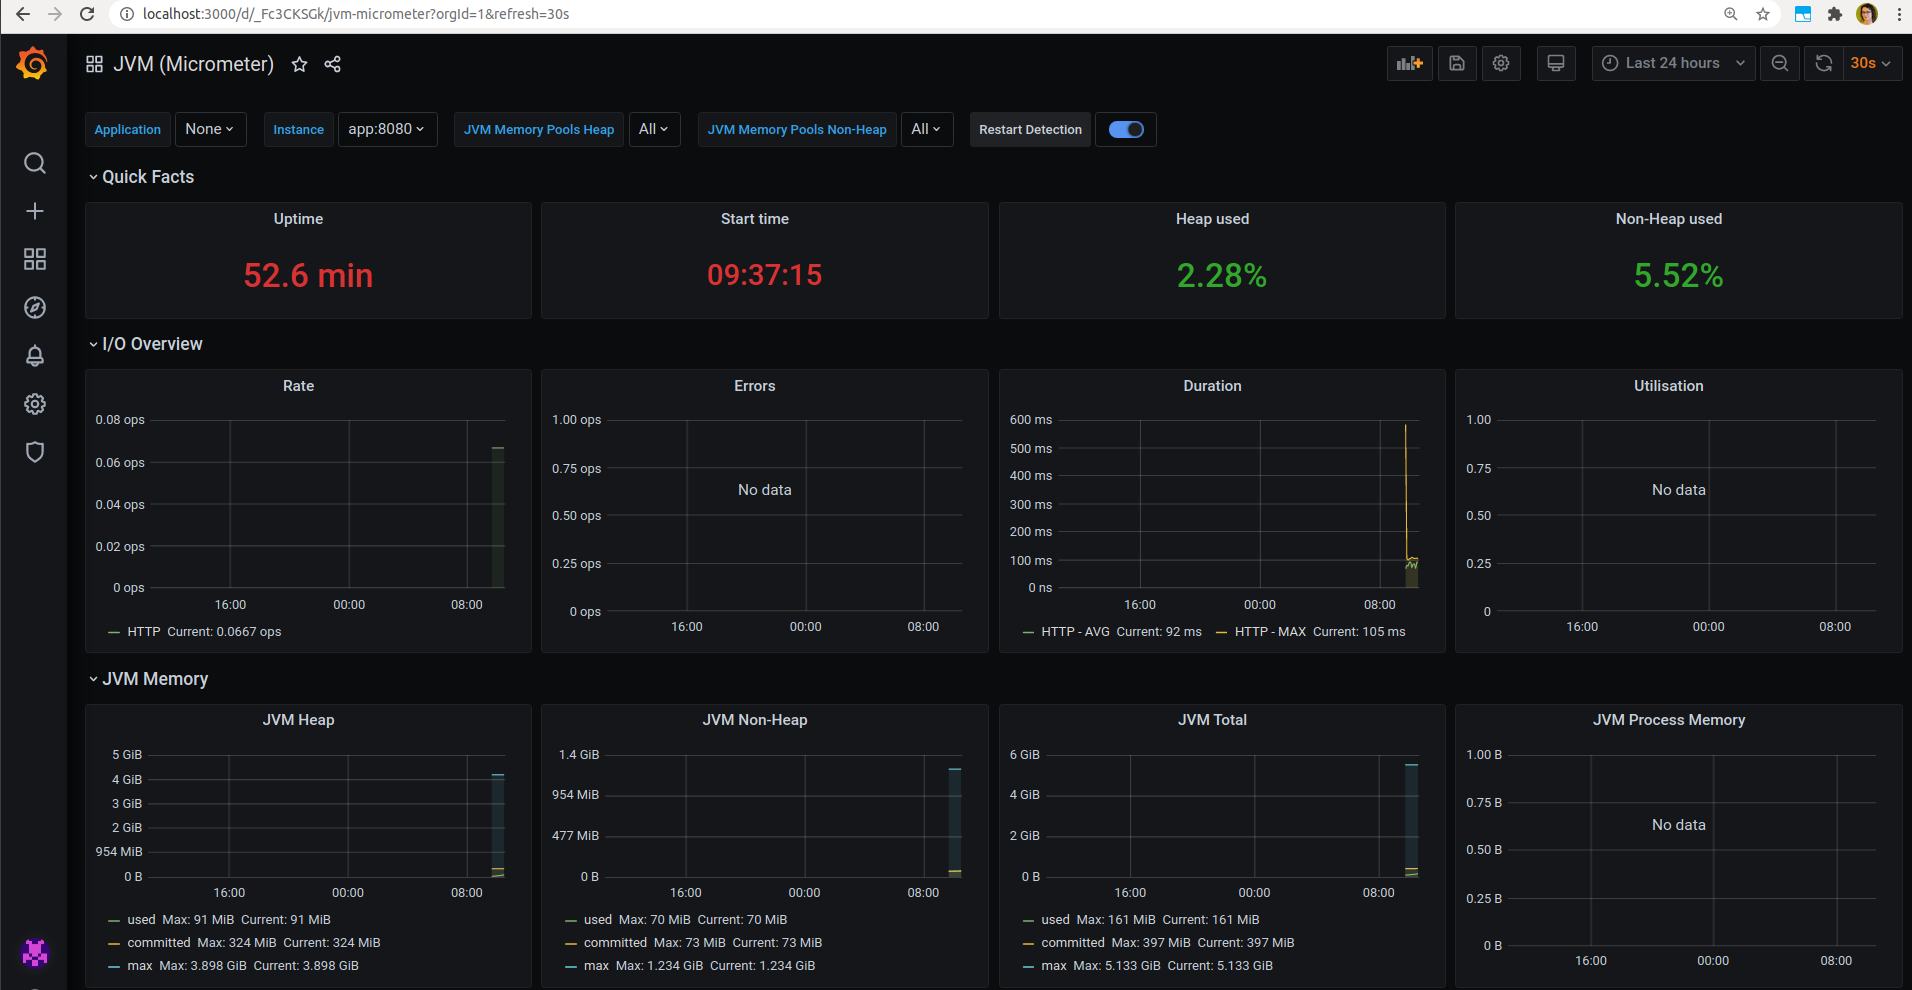
Troubleshooting
What to check when the configuration doesn’t work as planned?
http: proxy error connection refused
If you run services in Docker, you need to pay attention to the network configuration. Remember that:
The URL needs to be accessible from the grafana backend/server if you select this [
https://github.com/grafana/grafana/pull/11531proxy] access mode.
Therefore, you can’t specify the http://localhost:9090 or http://127.0.0.1:9090 as the datasource urls. In fact, you need to use the service_name:port structure. e.g. prometheus:9090. Additionaly, you can find other solutions in this StackOverflow question.
Post “prometheus:9090”: unsupported protocol scheme “prometheus”
Lately, I was configuring provisioning in Grafana 8+ and got the following error:

I had to edit the datasource.yml file to get the data source url to contain the appropriate protocol (http in my case):
|
1 2 3 4 5 6 |
… datasources: - name: Prometheus type: prometheus access: proxy url: http://prometheus:9090 |
As a result, the url that I got in the Grafana Data Source configuration looks like in the screenshot below:

Missing metrics in dashboards
The community dashboards aren’t always up to date with the Micrometer and Spring releases. Therefore, some data may be missing from the view over time:
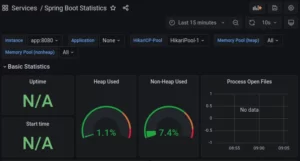
In addition to creating a custom dashboard, you can try to find a newer community dashboard:

As a result, you will have a more up-to-date dashboard configuration that won’t skip data:
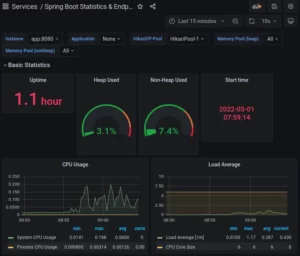
Learn more on provisioning Grafana data sources and dashboards
- To clarify optional configuration for Grafana provisioning, visit the official documentation
- In general, you should also read the official tutorial on using files to configure dashboards and data sources.
- Furthermore, you can read more about the
${DS_PROMETHEUS} was not founderror in the the Support dashboard variables in dashboard provisioning issue as well as in the Variables in provisioned dashboard json file? reddit post
Photo by Joshua Mcknight from Pexels

Thanks for this document, help me a lot to understood how deploy datasources and dashboards in my case from puppet!
“How to deal with the Datasource named ${DS_PROMETHEUS} was not found error”:For me, what worked best was to use Import button on the “Dashboards – Manage” screen.If I use that, it asks for the real datasource and replaces in during the import automatically (!).Best regards,Dan
Thanks for the tip!
Great tutorial, thanks!
Great tutorial, thanks!