
Prometheus is an open-source platform used to collect metrics from applications. You can easily apply it to monitor your Spring Boot project and scrape the Actuator /prometheus endpoint.
What we’re going to build
We’re going to configure Prometheus server to scrape data available on the /actuator/prometheus endpoint. Read the Monitoring Spring Boot projects with Actuator if your project doesn’t yet support metrics collection.
Meanwhile, you can clone the example spring-boot-log4j-2-scaffolding project from my GitHub repository and test it locally.
Why use Prometheus to monitor a Spring Boot app?
Prometheus is a good choice for reliable monitoring. It provides some statistics about a monitored system even if the subject suffers from a failure. As we can read in the documentation:
Each Prometheus server is standalone, not depending on network storage or other remote services. You can rely on it when other parts of your infrastructure are broken, and you do not need to setup extensive infrastructure to use it.
https://prometheus.io/docs/introduction/overview/#when-does-it-fit
Moreover, troubleshooting doesn’t take much time because the documentation is extensive and the tool is widely adopted in the community. Last but not least, integrating it with Spring Boot Actuator is straightforward.
However, it is not recommended in situations which require 100% accuracy, such as for per-request billing.
Monitor Spring Boot with Prometheus
In the beginning, we’ll expose Actuator endpoints to all users. Later, we’re going to configure Spring Boot security to keep those data locked behind basic authentication. Consequently, we’ll have to pass the default credentials for our Spring Boot app to the Prometheus server. In the end, we want to make sure that only authorised users will be able to browse application metrics and statistics.
How to allow unauthenticated access to Actuator endpoints
For now, we want to monitor Spring Boot with Prometheus without worrying about security configuration. Therefore, we configure Actuator to allow all requests:
|
1 2 3 4 5 6 7 8 9 10 11 12 13 14 15 16 17 18 19 |
// src/main/java/in/keepgrowing/springbootlog4j2scaffolding/config/security/ActuatorSecurity.java package in.keepgrowing.springbootlog4j2scaffolding.config.security; import org.springframework.boot.actuate.autoconfigure.security.servlet.EndpointRequest; import org.springframework.context.annotation.Configuration; import org.springframework.security.config.annotation.web.builders.HttpSecurity; import org.springframework.security.config.annotation.web.configuration.WebSecurityConfigurerAdapter; @Configuration public class ActuatorSecurity extends WebSecurityConfigurerAdapter { @Override protected void configure(HttpSecurity http) throws Exception { http .requestMatcher(EndpointRequest.toAnyEndpoint()) .authorizeRequests((requests) -> requests.anyRequest().permitAll()); } } |
Add Micrometer Registry Prometheus dependency
Above all, we need to add the Micrometer Registry Prometheus dependency to our pom.xml file:
|
1 2 3 4 5 6 7 |
# pom.xml … <dependency> <groupId>io.micrometer</groupId> <artifactId>micrometer-registry-prometheus</artifactId> </dependency> … |
Because our project uses Actuator, we don’t need to configure Micrometer Prometheus manually – it’ll collect and export data in a format compatible with a Prometheus server. You can find more details in the docs:
Spring Boot auto-configures a composite
https://docs.spring.io/spring-boot/docs/current/reference/html/production-ready-features.html#production-ready-metrics-getting-startedMeterRegistryand adds a registry to the composite for each of the supported implementations that it finds on the classpath. Having a dependency onmicrometer-registry-{system}in your runtime classpath is enough for Spring Boot to configure the registry.
Expose the proper Actuator endpoint
If you use default Actuator settings, the /actuator/prometheus endpoint is enabled but not exposed. Therefore, we need to explicitly include this endpoint in the list of exposed paths. Below you can see my example configuration that exposes prometheus alongside info and health endpoints:
|
1 2 3 |
# application.properties … management.endpoints.web.exposure.include=info,health,prometheus |
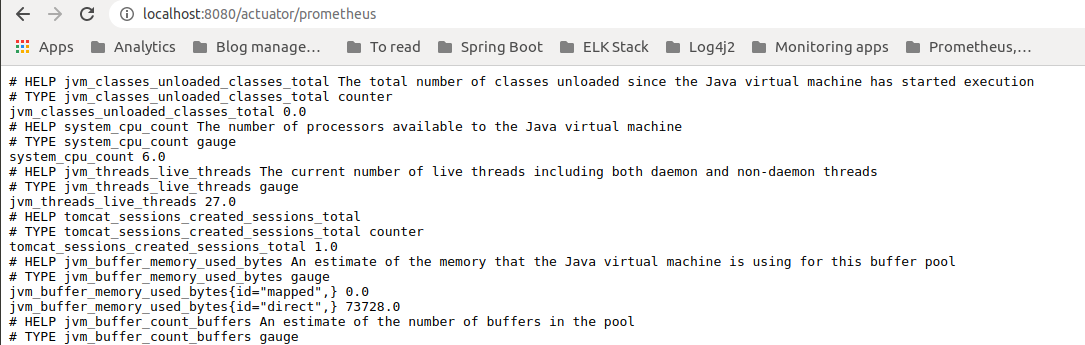
As a result, you can see the data available for scrapping on http://localhost:8080/actuator/prometheus:
Prometheus configuration
We’re going to configure the Prometheus server using both prometheus.yml file and command-line flags. Let’s start with the following configuration file:
|
1 2 3 4 5 6 7 8 9 |
# prometheus/prometheus.yml global: scrape_interval: 15s evaluation_interval: 15s scrape_configs: - job_name: 'spring-boot-app' metrics_path: '/actuator/prometheus' static_configs: - targets: ['app:8080'] |
For reference, you can explore the official extended example config file.
Global settings
If you want to specify parameters that should be applied to all other configuration contexts, enclose them in the global part. Thanks to that, you’ll also have default values that can be used for other sections. In the example file, I set up:
- scrape interval – how frequently to scrape targets, default is 1 minute;
- evaluation interval – how frequently to check against alerting and recording rules, default is 1 minute.
Set up the job for monitoring your Spring Boot app
Next, we’re going to tell Prometheus what are its targets and how to scrape them. With that in mind, we’re going to create a job regarding monitoring our Spring Boot app in the scrape_configs section. The job_name property should carry an unique value to allow distinguishing between collections of instances that Prometheus is scraping.
Furthermore, we need to specify the HTTP resource path where metrics are available. For our target, the proper Actuator endpoint is exposed under the /actuator/prometheus path.
Specify Prometheus targets
Prometheus supports service-discovery mechanisms. However, in our example we’re going to configure the target statically via the static_configs parameter.
Our Prometheus configuration ensures collecting metrics from the example Spring Boot project that is run in Docker. Because I run both Prometheus server and my Spring Boot project as Docker containers in a shared network, I can simply pass to the monitoring tool the service name defined for my Spring Boot project – app. Therefore, the Actuator endpoints are available for the scraping under the app:8080/… path.
In contrary, you may need to scrape metrics from a project that is run externally. Don’t forget to provide the proper host and port to its Actuator endpoint in the targets option in your prometheus.yml file.
You can’t use localhost:8080 in targets when running a Prometheus server in Docker. The workaround would be to use the “host” network_mode (only for a development environment) to enable reaching to localhost from a Docker container.
You can explore my complete docker-compose.yml file for more details.
Run a Prometheus server with Docker Compose
We’re going to build the prometheus service from the latest image:
|
1 2 3 4 5 6 7 8 9 10 11 12 13 14 15 16 17 18 19 20 21 22 23 |
version: "3.3" services: … prometheus: image: prom/prometheus command: - '--config.file=/etc/prometheus/prometheus.yml' - '--storage.tsdb.path=/prometheus' ports: - "9090:9090" networks: - internal volumes: - ./prometheus/:/etc/prometheus/ - prometheus:/prometheus depends_on: - app … networks: internal: volumes: prometheus: |
In addition to our prometheus.yml file, we’re going to add some configuration via the command-line flags. The difference between those two methods is explained in the documentation:
While the command-line flags configure immutable system parameters (such as storage locations, amount of data to keep on disk and in memory, etc.), the configuration file defines everything related to scraping jobs and their instances, as well as which rule files to load.
https://prometheus.io/docs/prometheus/latest/configuration/configuration/#configuration-file
First, with the --config.file flag, we specify which configuration file to load. Locally, our configuration is located under the ./prometheus/prometheus.yml path. It is mounted in the volumes section to the /etc/prometheus directory inside the container. As a result, we can tell Prometheus to look for the config under the /etc/prometheus/prometheus.yml path.
Furthermore, we configure the local storage. The --storage.tsdb.path flag determines where Prometheus writes its database. We want to write to our prometheus volume, instead of the default data/ directory in the container to hold data between service restarts. You can also browse documentation to find more storage configuration options.
I also exposed the default Prometheus port – 9090, so I can reach it from my localhost in the browser.
Run the application and the Prometheus server services:
|
1 2 3 |
$ mvn package $ docker-compose up -d app $ docker-compose up -d prometheus |
Explore Spring Boot metrics in Prometheus dashboard
To verify that Prometheus is able to connect with your app, visit http://localhost:9090/targets:
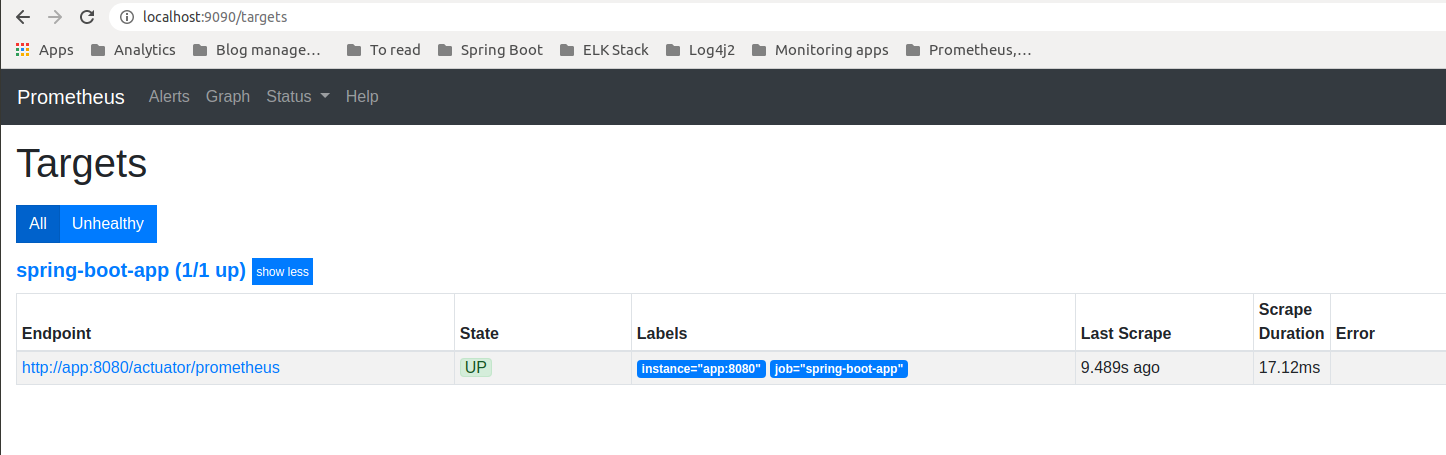
Remember that I could configure Prometheus target by simply providing the name of the container with my Spring Boot project – app, and port on which it runs – 8080, because both containers share a docker network.
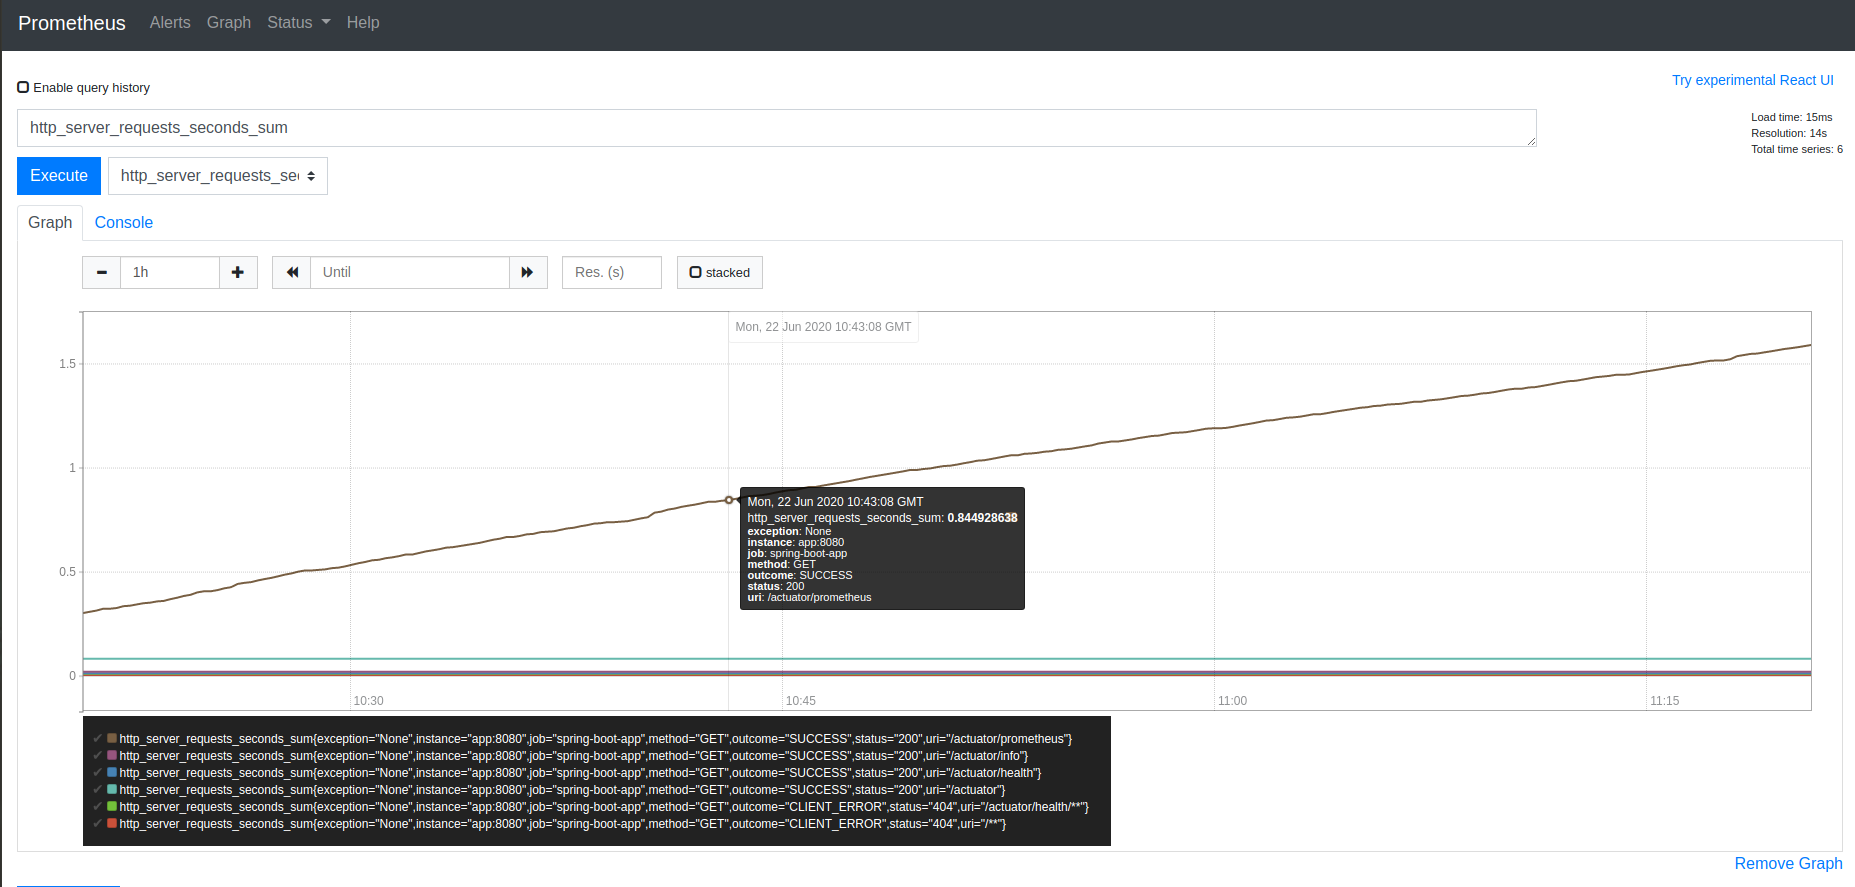
What’s more, the metrics collected from Spring Boot are available in the form of graph. Visit http://localhost:9090/graph and use the insert metric at cursor dropdown to choose a metric, e.g. http_server_requests_seconds_sum:
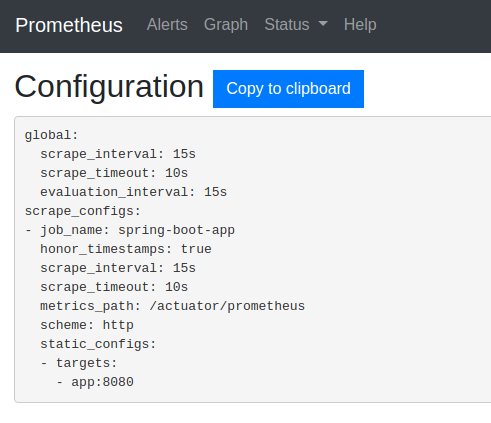
Furthermore, you can see the applied configuration under the http://localhost:9090/config url:
Secure Actuator endpoints
Finally, we’ll strengthen the security of our app by removing the Actuator endpoints from public access:
|
1 2 3 4 5 6 7 8 9 10 11 12 13 14 15 16 17 18 19 20 21 |
// src/main/java/in/keepgrowing/springbootlog4j2scaffolding/config/security/ActuatorSecurity.java package in.keepgrowing.springbootlog4j2scaffolding.config.security; import org.springframework.boot.actuate.autoconfigure.security.servlet.EndpointRequest; import org.springframework.context.annotation.Configuration; import org.springframework.security.config.annotation.web.builders.HttpSecurity; import org.springframework.security.config.annotation.web.configuration.WebSecurityConfigurerAdapter; @Configuration public class ActuatorSecurity extends WebSecurityConfigurerAdapter { @Override protected void configure(HttpSecurity http) throws Exception { http .authorizeRequests() .requestMatchers(EndpointRequest.toAnyEndpoint()) .authenticated() .and() .httpBasic(); } } |
Apply those changes to the app service:
|
1 2 |
$ mvn package $ docker-compose up -d --build app |
Consequently, we need to provide credentials for the spring-boot-app job in the Prometheus configuration :
|
1 2 3 4 5 6 7 8 9 |
# prometheus/prometheus.yml … scrape_configs: - job_name: 'spring-boot-app' … basic_auth: username: test password: test … |
Prometheus does not support environment variable substitution in configuration file. Therefore, I manually copied the default credentials defined in the application.properties file. There is also option for providing the file with the password_file parameter. Rebuild the service with the following command:
|
1 |
$ docker-compose up -d --build prometheus |
When you visit http://localhost:9090/config you’ll see the credentials presented like on the screenshot below:
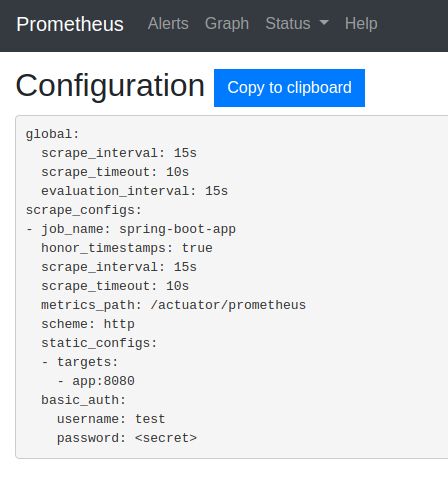
In addition, you can find the code applying Prometheus to a Spring Boot project in the commit 2ea8aa1c9763d6aa564b58baa1358bdda56d2a99.
Learn more on monitoring Spring Boot with Prometheus
- Read about Prometheus in Spring Boot documentation
- Explore Micrometer Prometheus documentation
- Spring Boot Actuator metrics monitoring with Prometheus and Grafana
- First steps with Prometheus
- If Prometheus is not what you need to monitor your app, you can explore other monitoring systems supported in Spring Boot.
- According to this Stack Overflow questions: can Prometheus store basic auth passwords in any format other then plain text? and Environment variables in prometheus values – the answer is no
- Other issue regarding Dynamic configuration variables in Prometheus Config
- Prometheus leaves configuration and runtime management to their respective roles. How might you integrate those?
Photo by Wesley Rocha from Pexels