
Identifying the unassigned shards in Elasticsearch and finding the reason why a shard can’t be allocated is critical when we want to get rid of the “NoShardAvailableActionException: No shard available” warning. Additionally, the Elasticsearch APIs also provide helpful hints pointing to the possible cause of this issue.
Verify which Elasticsearch shards are unassigned
First, we have to be aware that some shards could not be assigned. Below you’ll find example ways of learning about the issue: using monitoring dashboards, browsing log messages and, the most useful, calling the Elasticsearch cat shard API.
Shard overview in the ElastiHQ and Kibana dashboards
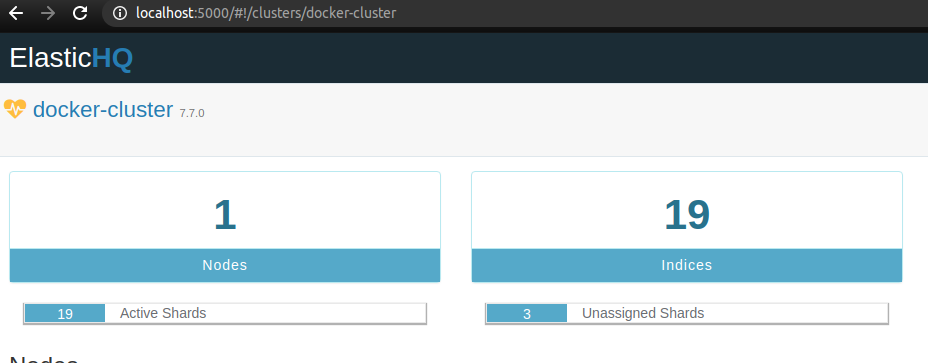
We can see that some shards were marked as unavailable in the ElasticHQ panel:
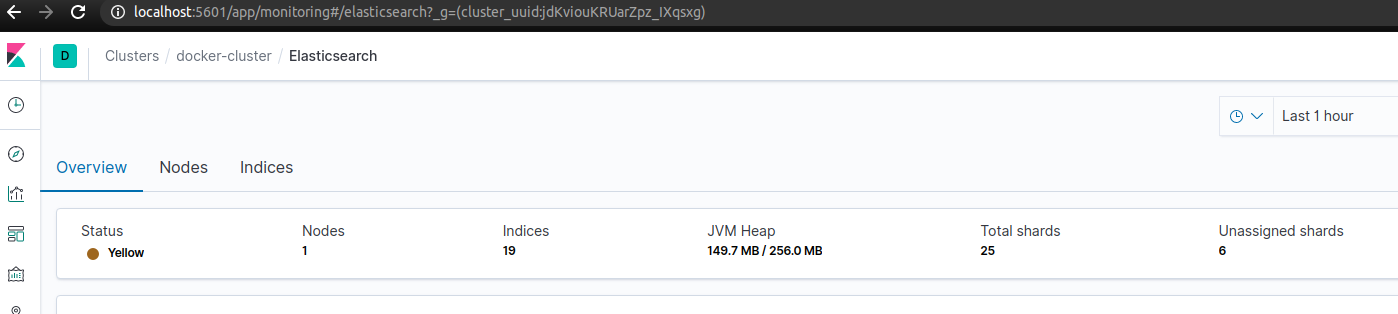
Furthermore, if we monitor our Elasticsearch cluster with Metricbeat and Kibana, we can visit the Overview tab in the dashboard to see how many shards are not allocated:
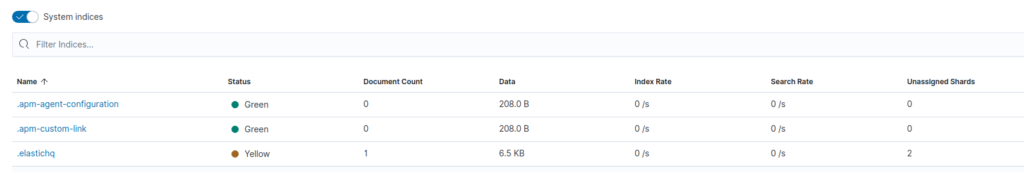
On the same page, we can list all indices to see those with the loose shards. As we can see on the example screenshot below, the .elastichq index has two unassigned shards:
After clicking on this index we can see a short summary for the shards on the bottom of the page:
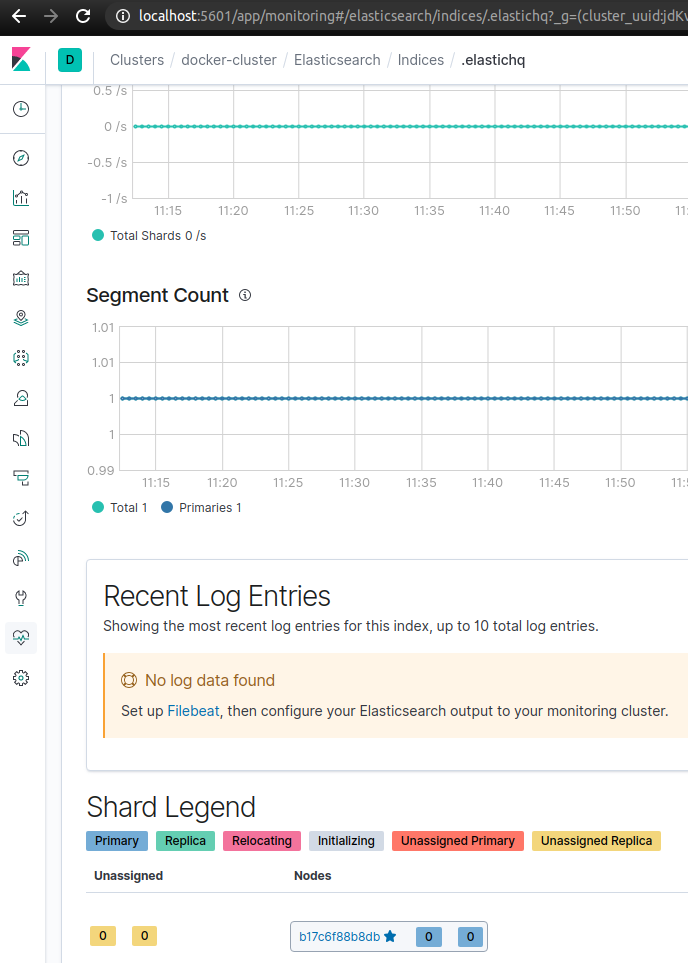
In other words, the Kibana dashboard can show us how many shards are unassigned, what type they are and where to look for them.
The unavailable shard warning in logs
When you browse the Elasticsearch logs you’ll see a warning messages for faulty shards similar to the following one:
|
1 2 |
{"type": "server", "timestamp": "2020-10-28T08:17:06,971Z", "level": "WARN", "component": "r.suppressed", "cluster.name": "docker-cluster", "node.name": "b17c6f88b8db", "message": "path: /.kibana/_doc/config%3A7.7.0, params: {index=.kibana, id=config:7.7.0}", "cluster.uuid": "jdKviouKRUarZpz_IXqsxg", "node.id": "0NnGs0hkTIaM5MzYo8tUvg" , "stacktrace": ["org.elasticsearch.action.NoShardAvailableActionException: No shard available for [get [.kibana][_doc][config:7.7.0]: routing [null]]", |
Details on the shards status returned by the Elasticsearch APIs
In order to see the state and details for all shards, we’re going to call the cat shards API:
|
1 |
$ curl -XGET -u elastic:test "localhost:9200/_cat/shards?v&h=index,shard,prirep,state,store,ip,unassigned.reason" |
The curl request consists of the following parts:
u– the parameter for specifying the credentials for our user in theusername:passwordformat;localhost:9300– the host and port of my Elasticsearch instance;_cat/shards– the cat API endpoint that we can call in a terminal or a Kibana console (it’s intended for human use, you should choose a corresponding JSON API for application consumption);v– one of the query parameters that includes column headings in the response, defaults tofalse;h– one of the query parameters that allows us to list what columns we want to see.
Consequently, the curl request will return all Elasticsearch shards with data about their state:
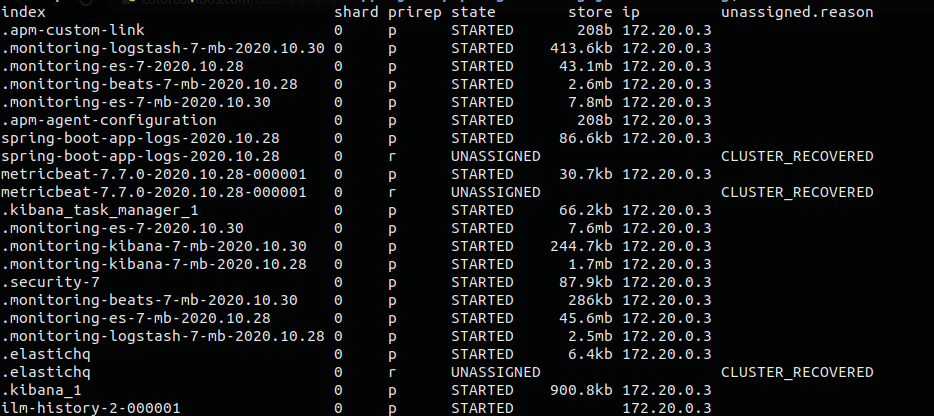
As a result, we not only identified unavailable shards but also got the simplified reason for the error.
On the other hand, if you want to only check the status, you can rely on the default set of columns, that doesn’t include the reason and copy the following request to the terminal (adjust the credentials, host and port):
|
1 |
$ curl -XGET -u elastic:test "localhost:9200/_cat/shards?v" |
If you’re working with a large amount of shards, you can limit the response with the <target> path parameter With this in mind, pass a comma-separated list of data streams, indices, or index aliases.
Diagnose the shard allocation issue
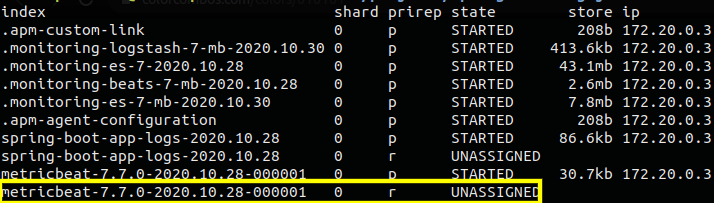
Elasticsearch provides the Cluster allocation explain API, which we can use to learn more about a particular shard. Thanks to listing the shards status above, I know that there are three of them that are not available:
spring-boot-app-logs-2020.10.28,metricbeat-7.7.0-2020.10.28-000001,.elastichq.
As an example, I’m going to call the explain API to gather data on the metricbeat-7.7… shard. For the request body I have to provide the shard index, name and whether it’s a primary shard or a replica. Fortunately, all those data were returned by the cat shard API that I’d called before. I just have to look at the values from the index, shard and prirep columns:
The values in the prirep (primaryOrReplica) column can be either p (primary) or r (replica).
Finally, I can send the following request:
|
1 2 3 4 5 6 7 |
curl -XGET -u elastic:test "localhost:9200/_cluster/allocation/explain?pretty" -H 'Content-Type: application/json' -d' { "index": "metricbeat-7.7.0-2020.10.28-000001", "shard": 0, "primary": false } ' |
The response:
|
1 2 3 4 5 6 7 8 9 10 11 12 13 14 15 16 17 18 19 20 21 22 23 24 25 26 27 28 29 30 31 32 33 34 |
{ "index" : "metricbeat-7.7.0-2020.10.28-000001", "shard" : 0, "primary" : false, "current_state" : "unassigned", "unassigned_info" : { "reason" : "CLUSTER_RECOVERED", "at" : "2020-10-30T07:24:36.268Z", "last_allocation_status" : "no_attempt" }, "can_allocate" : "no", "allocate_explanation" : "cannot allocate because allocation is not permitted to any of the nodes", "node_allocation_decisions" : [ { "node_id" : "0NnGs0hkTIaM5MzYo8tUvg", "node_name" : "b17c6f88b8db", "transport_address" : "172.20.0.3:9300", "node_attributes" : { "ml.machine_memory" : "16740577280", "xpack.installed" : "true", "transform.node" : "true", "ml.max_open_jobs" : "20" }, "node_decision" : "no", "deciders" : [ { "decider" : "same_shard", "decision" : "NO", "explanation" : "the shard cannot be allocated to the same node on which a copy of the shard already exists [[metricbeat-7.7.0-2020.10.28-000001][0], node[0NnGs0hkTIaM5MzYo8tUvg], [P], s[STARTED], a[id=q5K3ZumISXeipxx03oUkXA]]" } ] } ] } |
From this response I can extract the following data helpful in solving the issue:
"current_state" : "unassigned"– the current state of the shard (line 5);"reason" : "CLUSTER_RECOVERED"– why the shard originally became unassigned (line 7);"can_allocate" : "no"– whether to allocate the shard (line 11);"node_decision" : "no"– whether to allocate the shard to the particular node (line 24);"decider" : "same_shard"– which decider gave thenodecision for the node (line 27);"explanation" : "the shard cannot be allocated to the same node on which a copy of the shard already exists…"– a reason for the decision (line 29).
With this set of information, fixing the unassigned shard problem should be a lot easier.
More on debugging an unassigned shards in Elasticsearch
- Read this Elasticsearch / Kibana: NoShardsAvailableException question on StackOverflow.
- Browse the documentation for the cluster allocation explain API.
- Learn how to monitor Elastic Stack with Metricbeat and Kibana.
Photo by Ekaterina Belinskaya from Pexels
how does one actually fix the proposed error?experiencing this myself, no clue how to resolve