
When you use Metricbeat to monitor your Elastic Stack, you may notice in your Kibana dashboard the Standalone cluster. It contains metrics, usually taken from Filebeat or Logstash, that belongs to a different cluster.
The reason for the Standalone cluster in Kibana
In general, metrics gathered from Filebeat and Logstash will be shown with the rest of the cluster services by default if their outputs are configured to use the elasticsearch plugin. Furthermore, you can find more details in this elastic forum issue and in the following code comment taken from the beats repo:
If output.elasticsearch is enabled, the UUID is derived from the Elasticsearch cluster referenced by output.elasticsearch.
https://github.com/elastic/beats/blob/master/libbeat/_meta/config/monitoring.reference.yml.tmpl
To illustrate, look at this example Logstash configuration that sends data directly to the elasticsearch output:
|
1 2 3 4 5 6 7 |
# logstash/pipeline/logstash.conf … output { elasticsearch { … } } |
Therefore, we can see the Logstash metrics among other services that are run within the same cluster – the UUID is derived from the cluster referenced by the output.elasticsearch plugin. On the other hand, the situation looks different for our example Filebeat configuration. It sends data to Logstash:
|
1 2 3 4 5 |
# filebeat/filebeat.yml … output: logstash: … |
As a result, the Filebeat metrics are shown in a separate cluster – the Standalone cluster.
Display metrics from all cluster services on one dashboard
In our example, we have to explicitly set the cluster id in the Filebeat config if we want its metrics to be displayed among the other services from the same cluster. Additionally, you can apply the solution described in this article to the spring-boot-log4j-2-scaffolding project.
Get Elasticsearch cluster_uuid
I wasn’t able to find a way to set a cluster_uuid for my Elastic Stack services. Therefore, we have to retrieve it from a running elasticsearch instance first. We can do this in two ways:
- Browse Elasticsearch logs. I run my services with Docker and use IntelliJ Docker support . Therefore, I can access container logs like on the image below:
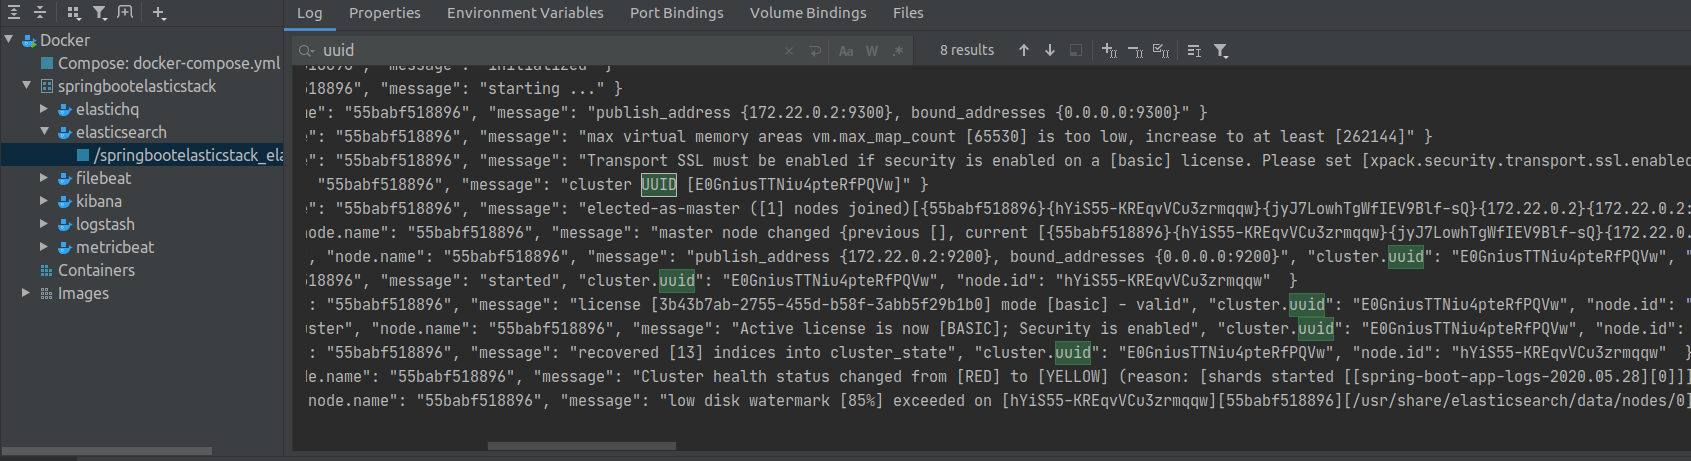
- Run the following Cluster state API request in your terminal. Adjust credentials (I set them in this .env file) and host if needed:
|
1 |
$ curl -X GET -u elastic:test "localhost:9200/_cluster/state/blok?pretty" |
As a result, you should get a similar response to the one shown below:
|
1 2 3 4 |
{ "cluster_name" : "docker-cluster", "cluster_uuid" : "E0GniusTTNiu4pteRfPQVw" } |
Set cluster_uuid in a Filebeat service
Finally, we can use the monitoring.cluster_uuid property described in the repo with the following comment:
|
1 2 3 4 5 6 7 |
# beats/libbeat/_meta/config/monitoring.reference.yml.tmpl … # Sets the UUID of the Elasticsearch cluster under which monitoring data for this # {{.BeatName | title}} instance will appear in the Stack Monitoring UI. If output.elasticsearch # is enabled, the UUID is derived from the Elasticsearch cluster referenced by output.elasticsearch. #monitoring.cluster_uuid: … |
Add the cluster id that you got from the Elasticsearch to the Filebeat monitoring configuration:
|
1 2 3 4 5 |
# filebeat/filebeat.yml … monitoring: enabled: "false" cluster_uuid: "E0GniusTTNiu4pteRfPQVw" |
If you work with the example project, remember that the filebeat.yml file is inserted into the container with this Dockerifle. Therefore, after every configuration change, start the filebeat service with the following command:
|
1 |
$ docker-compose up -d --build filebeat |
Set cluster_uuid in a Logstash service
If your Logstash output plugin is different than elasticsearch, add the monitoring.cluster_uuid parameter to the logstash.conf file as well.
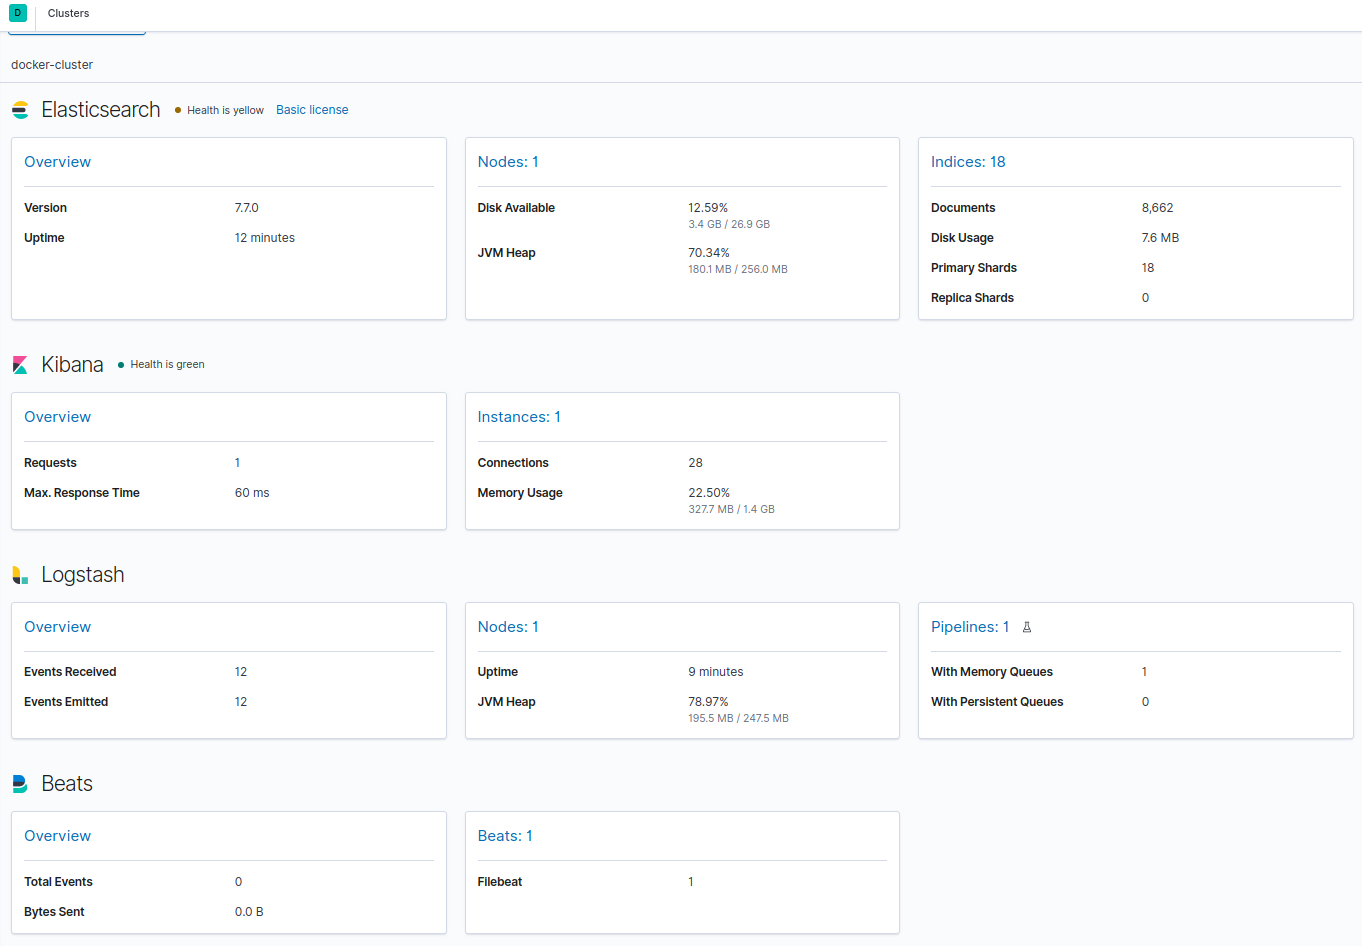
Verify that there is no Standalone cluster in your Kibana dashboard
The metric page should display data about all services within the cluster like on the screenshot below:
Learn more on managing the Standalone cluster in Kibana
- Firstly, find more details in the Filebeat creates a “Standalone Cluster” in Kibana Monitoring issue
- Beats: Add ability to override cluster_uuid in monitoring data
- Logstash: Add ability to override cluster_uuid in monitoring data
- Beats: Allow users to set just monitoring.cluster_uuid
- Furthermore, you can read more in the Monitoring Elastic Stack post
Photo by Retha Ferguson from Pexels